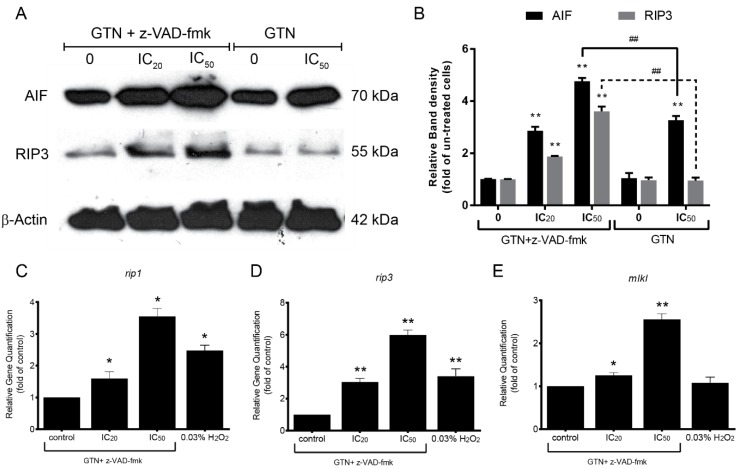
Figure 4.
Enhanced necroptosis protein and gene expressions in the GTN and pan-caspase inhibitor-treated MDA-MB-231 cells. The Apoptosis-inducing factor (AIF) and RIP3 protein band density representing protein expression were performed by Western blotting (A) and the average band density compared to β-actin, a loading control, was measured by ImageJ software, and the number of folds compared to β-actin are illustrated in the bar graph (B). Bar graphs of rip1, rip3, and mlkl mRNA expressions are demonstrated and normalized with gapdh as a housekeeping gene. The gene expression was performed by SYBR green-based real-time RT-PCR (C, D, and E). The data were obtained from three independent experiments in triplicate, the significance of statistical values compared to the z-VAD-fmk-treated alone group are marked with * p < 0.05; ** p < 0.01 and compared to the GTN alone group are marked with ## p < 0.01.

