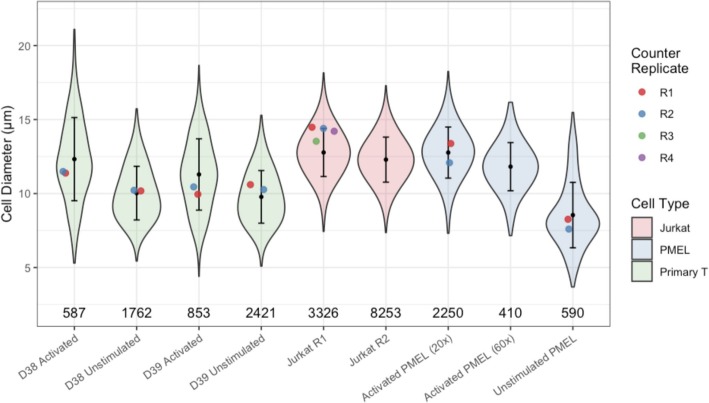
Fig. 10.
T cell size recovery comparison (notebook) showing inferred cell diameter distributions (violin with bars indicating +/− 1 s.d.) vs point estimates of mean diameter from Thermo Fisher cell counter (dot) as well as filtered single cell population sizes (counts); All images taken at 20x magnification except where indicated otherwise. See supplementary file Additional file 2: Figure S2 for a comparison of these results to those from the same workflow without much of the gating used here to remove invalid cells

