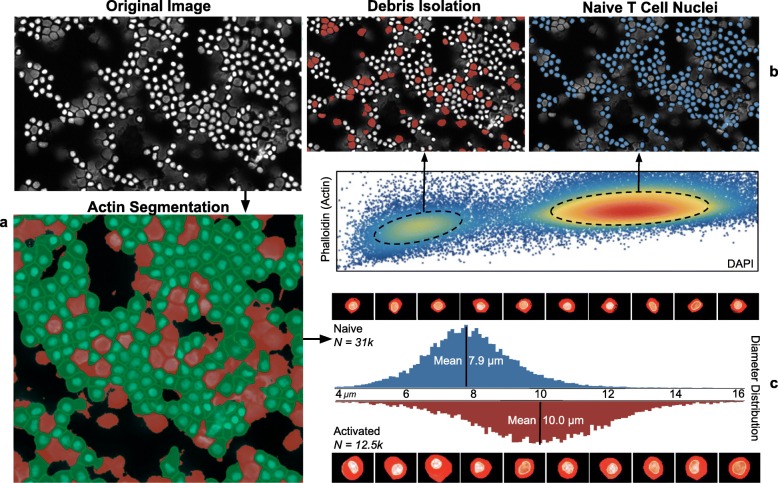
Fig. 9.
Cell diameter recovery workflow as annotated Explorer screenshots. a Unstimulated/naive cells with DAPI stain (gray), binary PHA image (red), and resulting cell segmentation (green). b Projection of modes in phalloidin/DAPI distribution to segmented cells in original image. c Diameter distribution comparison for unstimulated and activated samples along with corresponding single cell images

