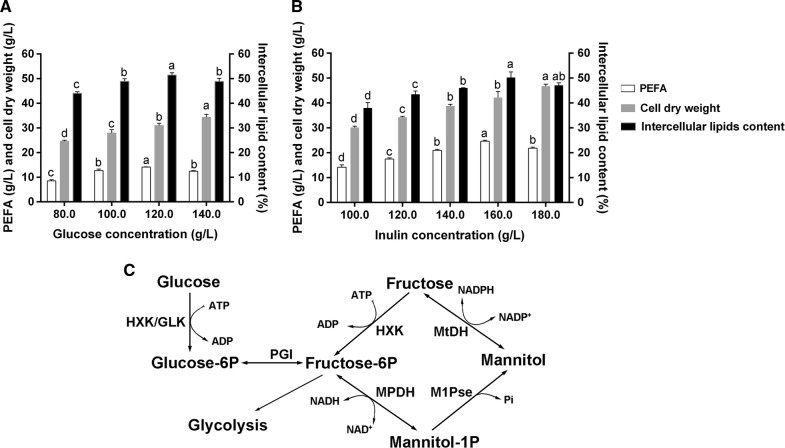
Fig. 4.
Effects of different concentrations of different concentrations of glucose (A) and different concentrations of inulin (B) on PEFA production, intercellular lipid content and cell growth. The values were means of three independent determinations. a,b,c,dMean values with different superscript letters differ significantly and were determined statistically as mentioned in “Materials and methods” (one way ANOVA, Tukey, P < 0.05). Separate analysis was done for the groups of PEFA, cell dry weight and intercellular lipids content. C Mannitol biosynthetic pathway in fungi. HXK, hexokinase; GLK, glucose kinase; MtDH, mannitol dehydrogenase; MPDH, mannitol-1-phosphate dehydrogenase; M1Pse, mannitol-1-phosphate phosphatase

