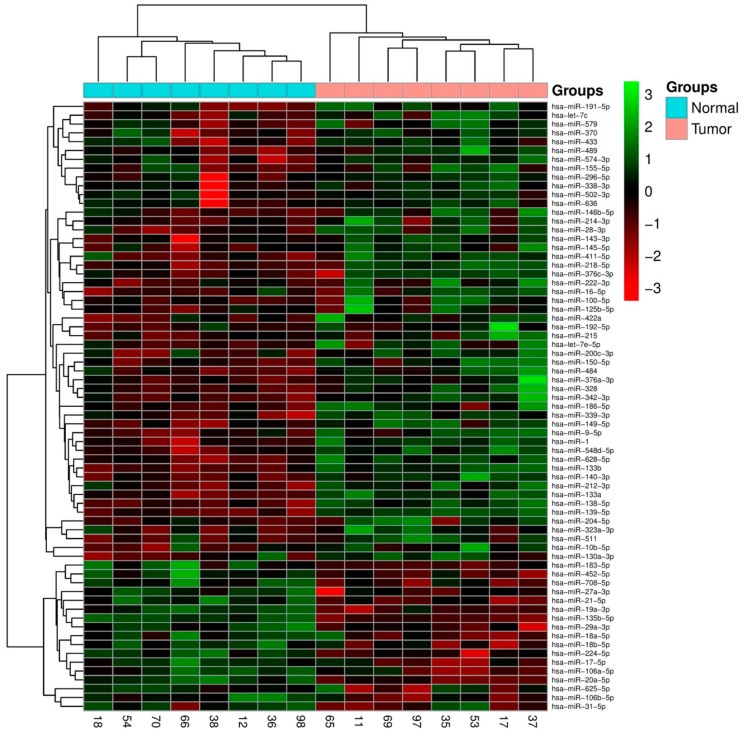
Figure 1.
A 67-miRNA expression signature reveals changes between colorectal cancer (CRC) and NCT. Unsupervised hierarchical clustering analysis of CRC (blue) and NCT (pink) was performed using 67 differentially expressed miRNAs. Dendrograms of clustering analysis for samples and miRNAs are displayed on the top and left, respectively, and depict similarities in the miRNA expression profiles among the samples. The relative up and down regulation of miRNAs is indicated by red and light green, respectively. hsa; Homo sapiens. Endogenous control assays are present (MammU6, RUN44, and RUN48).

