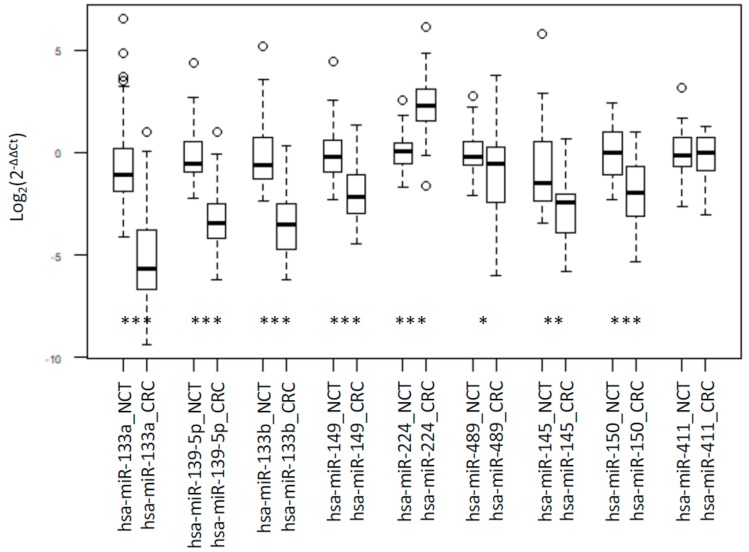
Figure 2.
Box plot of RT-PCR results. RT-PCR quantification of miRNAs. The box border represents the interquartile range, the horizontal line in the box is the median, and circles represent outliers. Values are expressed as Log2(2−ΔΔCt). *, ** and *** represent significant differences between CRC and NCT at p value < 0.05, < 0.01 and < 0.001, respectively.

