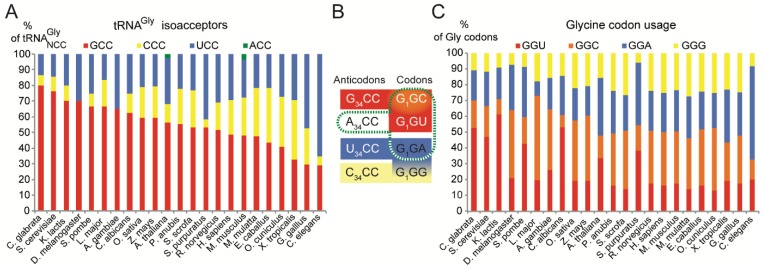
Figure 2.
Distribution of tRNAGly isoacceptors and Gly codon usage in a representative set of eukaryotes. (A) Histogram representing the distribution of tRNAGly isoacceptor genes per organism expressed as percentages (data from http://gtrnadb.ucsc.edu/). (B) The codon reading properties of tRNAsGly are represented with boxes using the colour code used in the histograms of panels A and C. The decoding properties of the rarely found tRNAGlyA34CC (modified in I34CC) are represented with a dashed green box. (C) The histogram represents the codon usage for Gly codons per organism, expressed as percentages (data from http://www.kazusa.or.jp/codon/).

