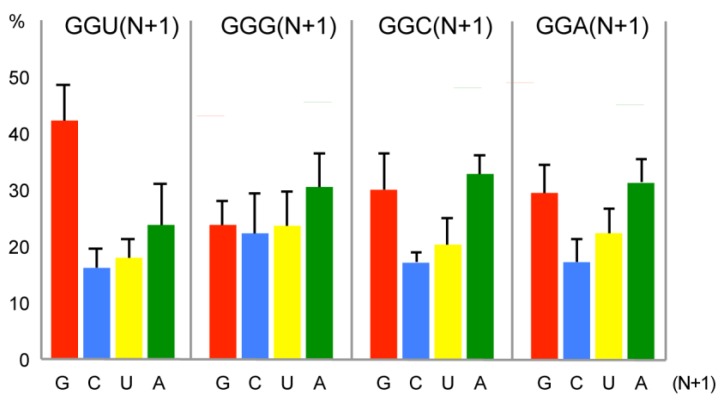
Figure 3.
Distribution of nucleotide +1 downstream from the four Gly codons in 23 eukaryotic genomes. 35,246,252 Gly codons were analysed. Results are expressed as percentages. The standard deviation bars are showing the dispersion between the genomes. The x-axis corresponds to the nucleotides found at position +1 after the four Gly codons.

