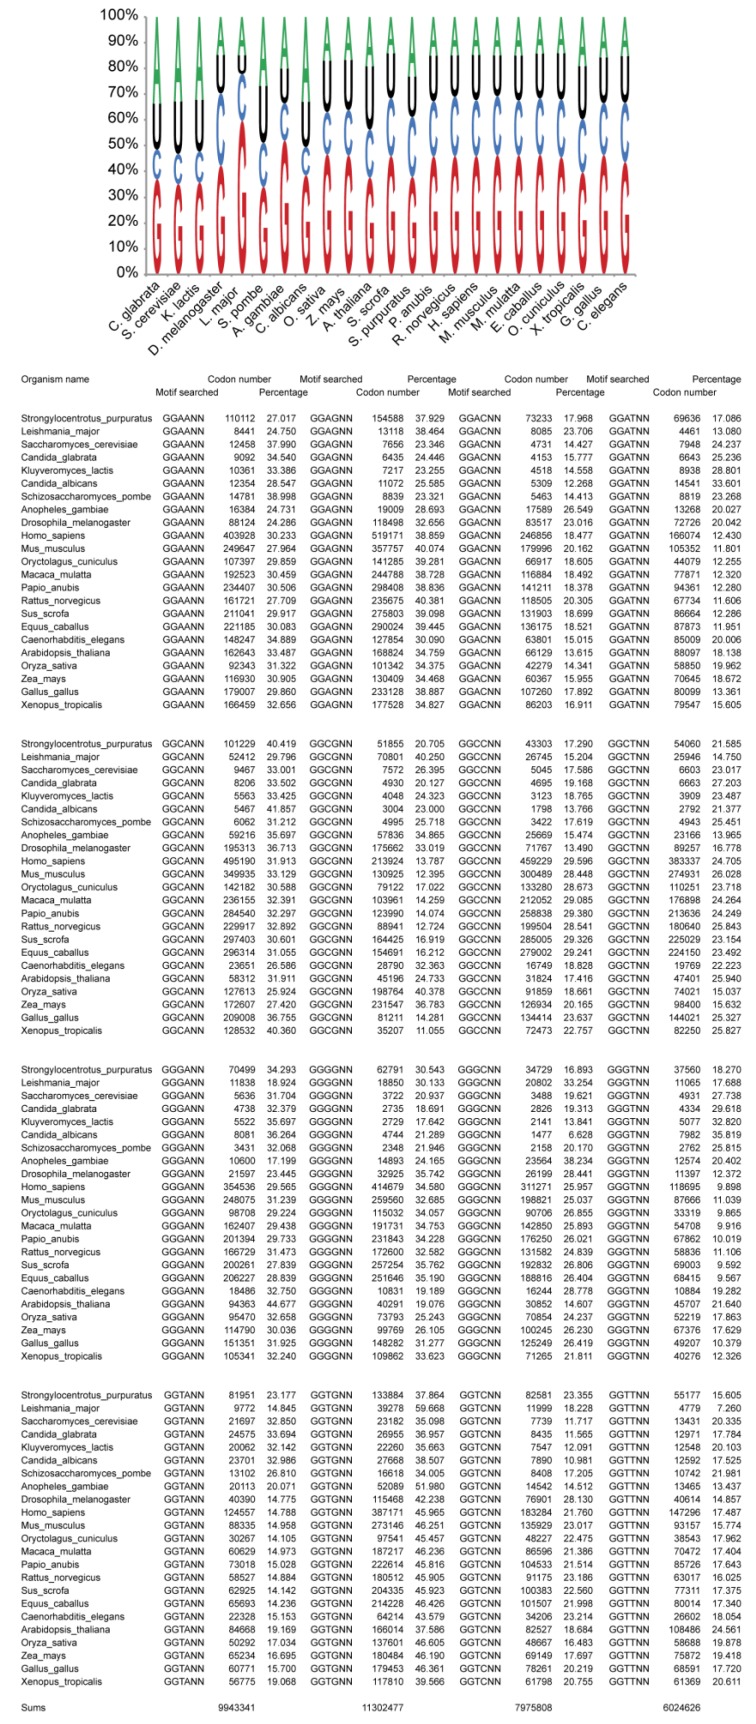
Figure A1.
Distribution of nucleotide +1 downstream of GGU Gly codons in each of the 23 eukaryotic genomes. 35,246,252 Gly codons were analysed. Results are expressed as percentages. The x-axis corresponds to the organisms while the y-axis refers to the occurrence of each nucleotide at position +1. Details of the analysis are shown below the graph.

