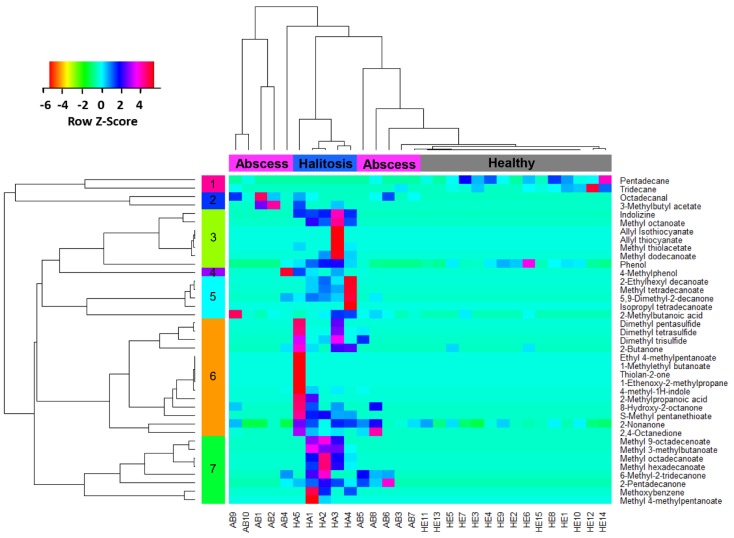
Figure 3.
Hierarchical cluster analysis and heatmap of VOC profiles based on peak areas from chromatograms. Columns represent three groups of patients (total of 30 individuals): healthy (15), segregated from an abscess (10) and halitosis (5). Rows represent 39 discriminating VOCs (orange, low abundance; red, high abundance).

