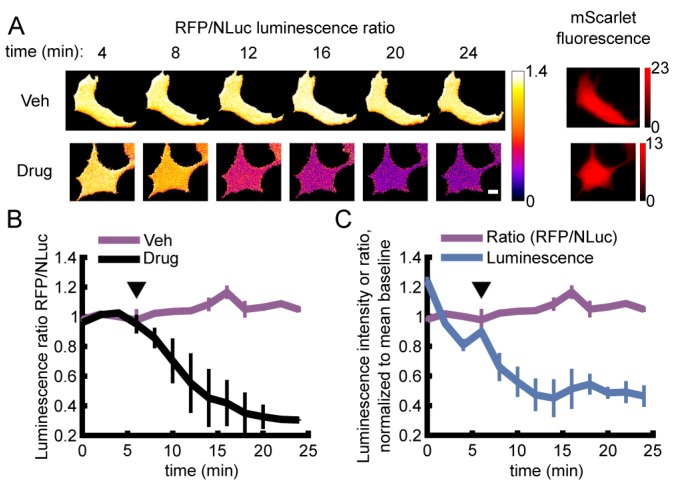
Figure 3.
Live single-cell BRET microscopy. (A,B) HEK293A cells expressing ARSeNL were subjected to either metabolic inhibition with 10 mM 2DG (2-deoxyglucose) and 2.5 μM oligomycin A (Drug) or 10 mM glucose and DMSO (Veh) just before acquisition marked by the arrowhead. (A) BRET ratio images for typical cells undergoing each treatment at different time points. Scale bar: 10 μm. (B) The sensor BRET ratio faithfully reports the decrease in cellular ATP in inhibitor-treated cells (Drug, n = 4 independent wells, 7–9 cells/well) and no change in the glucose control (Veh, n = 3). Error bars represent mean ± sd. (C) The BRET ratio (purple) is stable over time, even as total luminescence intensity decays (blue). The BRET ratio (purple) is the same data shown in (B).

