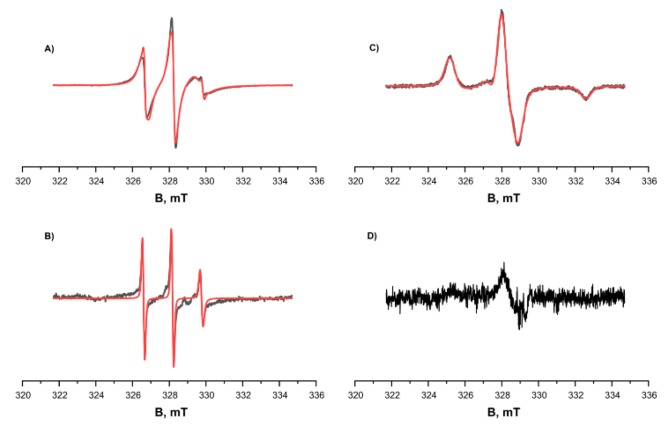
Figure 4.
CW EPR spectra of RL2-MTSL at different temperatures and different pH levels (black curve: experimental, red one: simulated). (A) and (C) pH = 3.9, acetate buffer, 50% D2O, 50% deuteroglycerol. (B) and (D) pH = 7.5. (A) and (B) T = 300 K. (C) and (D) T = 132 K. Parameters of the simulation were as follows: gxx = gyy = 2.0071, gzz = 2.0022, Axx = Ayy = 0.5 mT, Azz = 3.7 mT, τcorr = 1.95 ns. The additional curve in spectrum A corresponds to free nitroxide at a concentration ~4% of the attached MTSL with correlation time τcorr = 0.27 ns and is clearly visible in spectrum (B).

