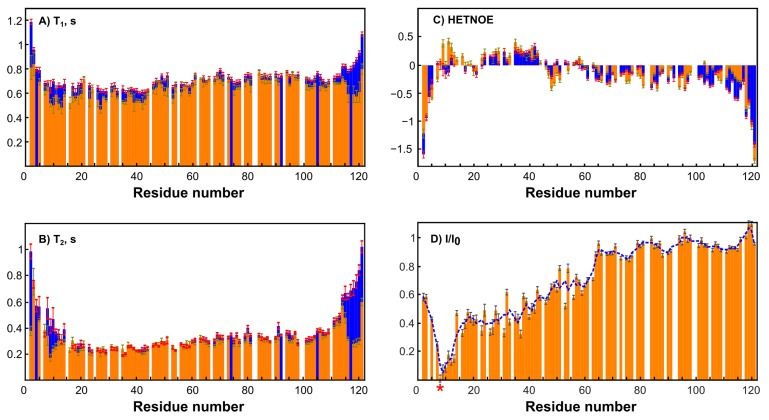
Figure 7.
Dynamics and PRE data on RL2 and MTSL-RL2. Error bars represent random noise error of fitting the experimental data. (A) A comparison of T1 values of RL2 at pH 3.5 (blue) and diamagnetic MTSL-RL2 (orange). (B) The comparison of T2-values of RL2 at pH 3.5 (blue) and diamagnetic MTSL-RL2 (orange). (C) A comparison of hetero NOE values of RL2 at pH 3.5 (blue) and diamagnetic MTSL-RL2 (orange). (D) Integral ratios of peaks in the HSQC paramagnetic and diamagnetic spectra of MTSL-RL2. The blue dashed curve is a three-point moving window average for the best trend view. The asterisk indicates the MTSL-label site (Cys8).

