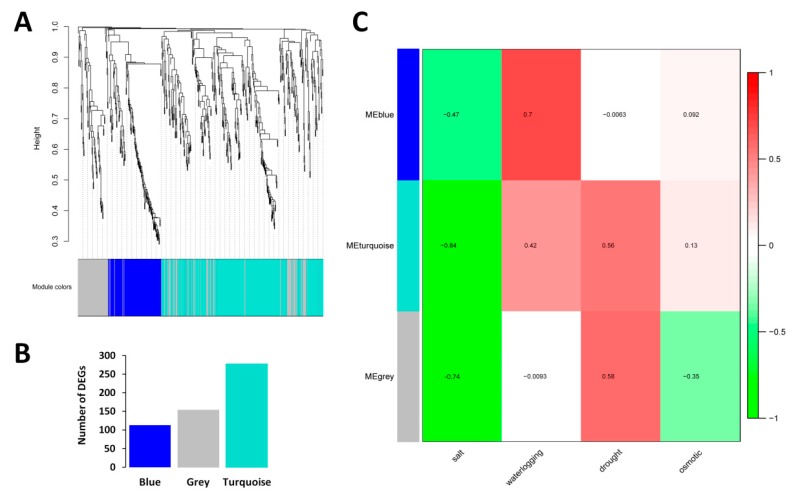
Figure 2.
Detection of co-expressed modules in the sesame core abiotic stress responsive genes based on WGCNA. (A) Dendrogram showing the different genes clustered into co-expressed modules. (B) Number of assigned DEGs to the different modules. (C) Association between co-expressed modules and abiotic stresses in sesame. The numbers represent the Pearson correlation coefficients. Positive correlation is colored in red while negative correlation is colored in green.

