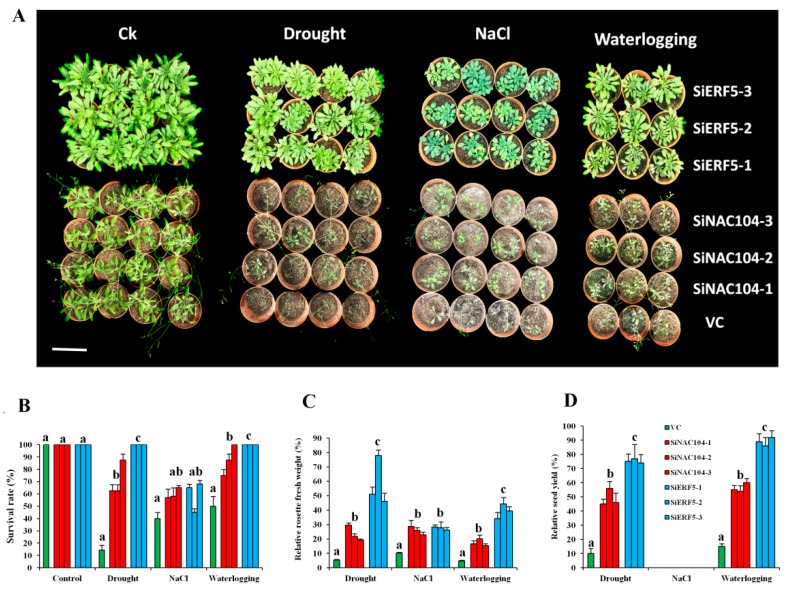
Figure 6.
Functional characterization of SiERF5- and SiNAC104-overexpressing lines and their counterparts vector control (VC) plants under drought (20 days), salt (200 mM NaCl) and waterlogging (18 days). (A) Phenotypes of the plants. The bar represents 8 cm (B) Survival rate of the plants. (C) Relative rosette fresh weight. (D) Relative seed yield. The relative values are estimated as the ratio of the data recorded after stress period in stressed and control plants. Values are means ± SD from two independent measurements. For each treatment, bars with different letters are significantly different (p ≤ 0.05).

