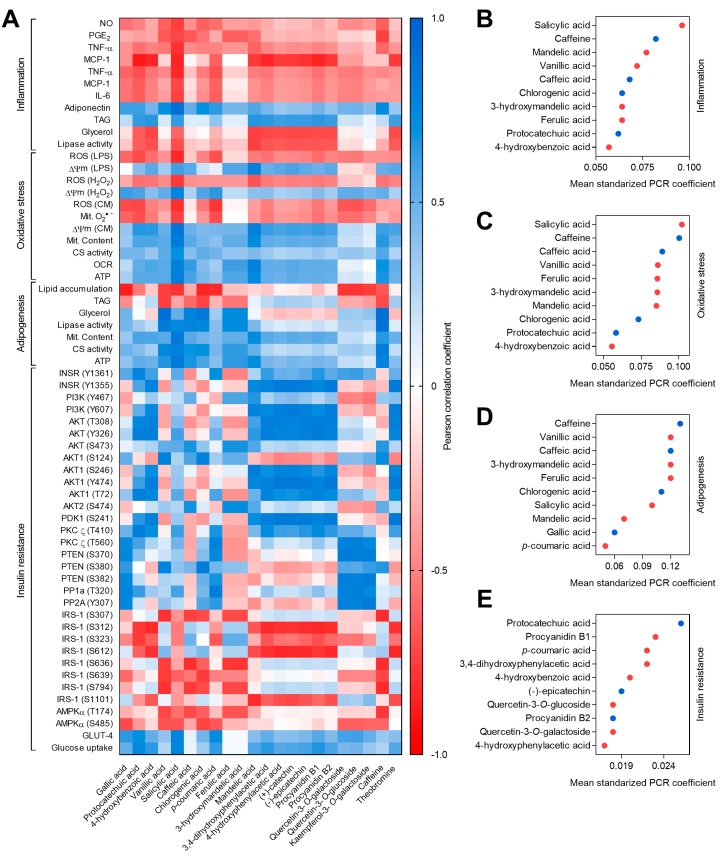
Figure 1.
Heat map of the Pearson correlation coefficient established among observed in vitro effects and the concentration of different phytochemicals in coffee and cocoa by-products (A) and the top ten mean standardized principal component regression (PCR) coefficients of the regression constructed among the phytochemicals identified in coffee husk, coffee silverskin, and cocoa shell aqueous extracts and the potential of the extracts in the different biomarkers of inflammation (B), oxidative stress (C), adipogenesis (D), and insulin resistance (E). Blue (●) and red (●) circles indicate major (one of the ten in higher concentration) and minor phytochemicals, respectively.

