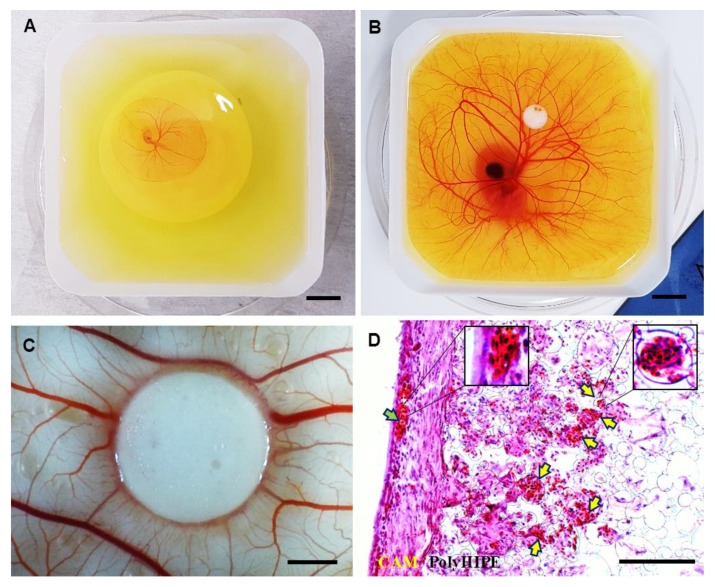
Figure 5.
Chick embryos in a petri dish on (A) embryonic development day 3 and (B) embryonic development day 7 (Scale bar represents 10 mm). (C) PCL polyHIPE on chorioallantoic membrane (CAM) at day 14 (Scale bar represents 2 mm). (D) H&E image of PCL polyHIPE on CAM at day 14. (Green arrow indicates the blood vessel on the CAM itself; yellow arrows indicate the blood vessels in PCL polyHIPE (Scale bar represents 100 µm).

