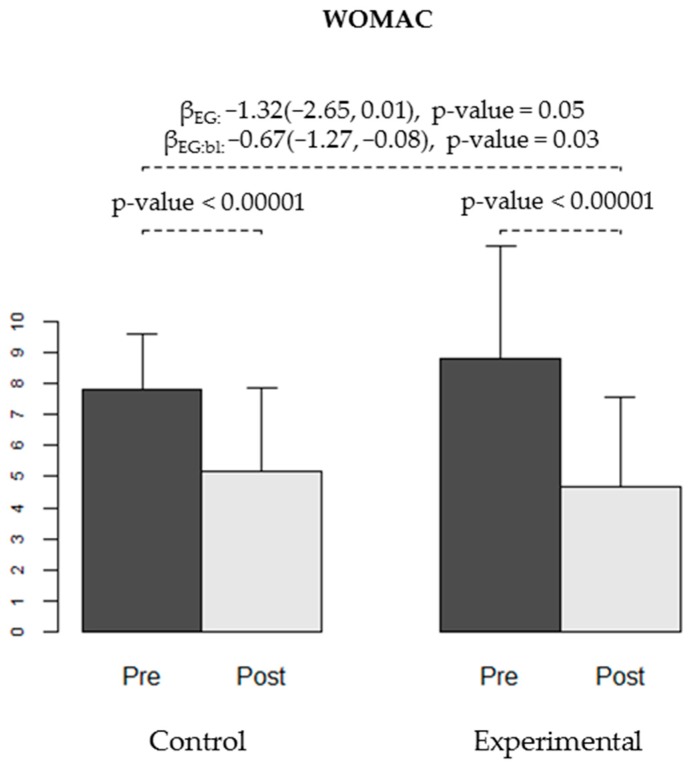
Figure 2.
Pain level measured using the Western Ontario and McMaster Universities Osteoarthritis Index (WOMAC) test at baseline (pre-) and at the end of the trial (post-intervention) in both groups (CG and EG). The bars show the average level of pain observed in each group for each time-point, and the error bars represent the standard deviation. The p-values for the pain reduction obtained in each group are shown. Regression coefficients for experimental group (βEG), for the interaction between group and baseline score (βEG:bl) and respective 95% confidence intervals and p-values are displayed.

