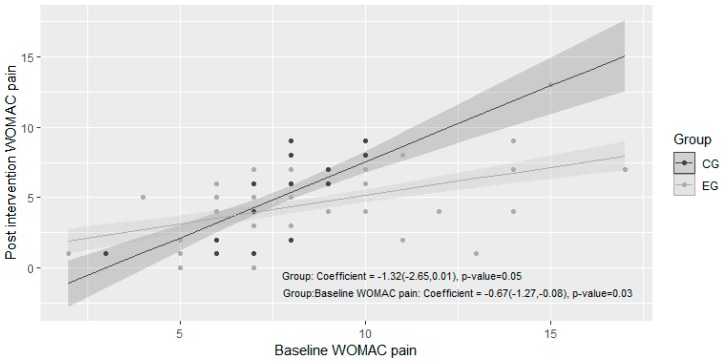
Figure 3.
Linear regression for the response variable “post intervention WOMAC pain score” considering the group as the predictor variable and the baseline Western Ontario and McMaster Universities Osteoarthritis (WOMAC) pain score as a covariate. The points represent the real values of each individual and the lines represent the fitted model, with a grey shade representing the 95% confidence intervals for the predictions. The regression coefficients regarding the group effect are shown, with the corresponding 95% CI and p-value.

