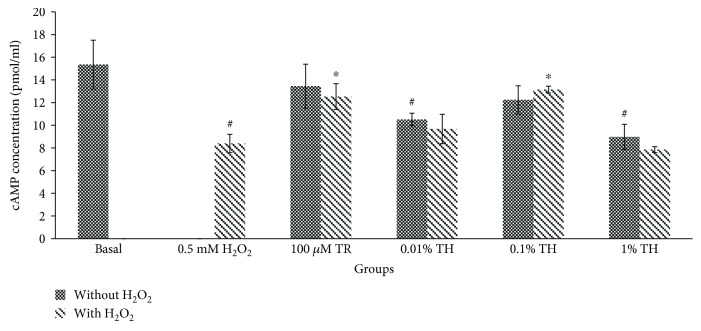
Figure 6.
Amount of cAMP production in HUVECs. The cAMP concentration (pmol/ml) of cells treated with TH alone or induced with H2O2. Values are expressed as the mean ± SEM from three independent experiments. Hash (#) represents the significant difference compared to the untreated group (basal), p < 0.05; asterisk (∗) represents the significant difference compared to the H2O2 alone group, p < 0.05. Basal = untreated; TR = Trolox; TH = Tualang honey.

