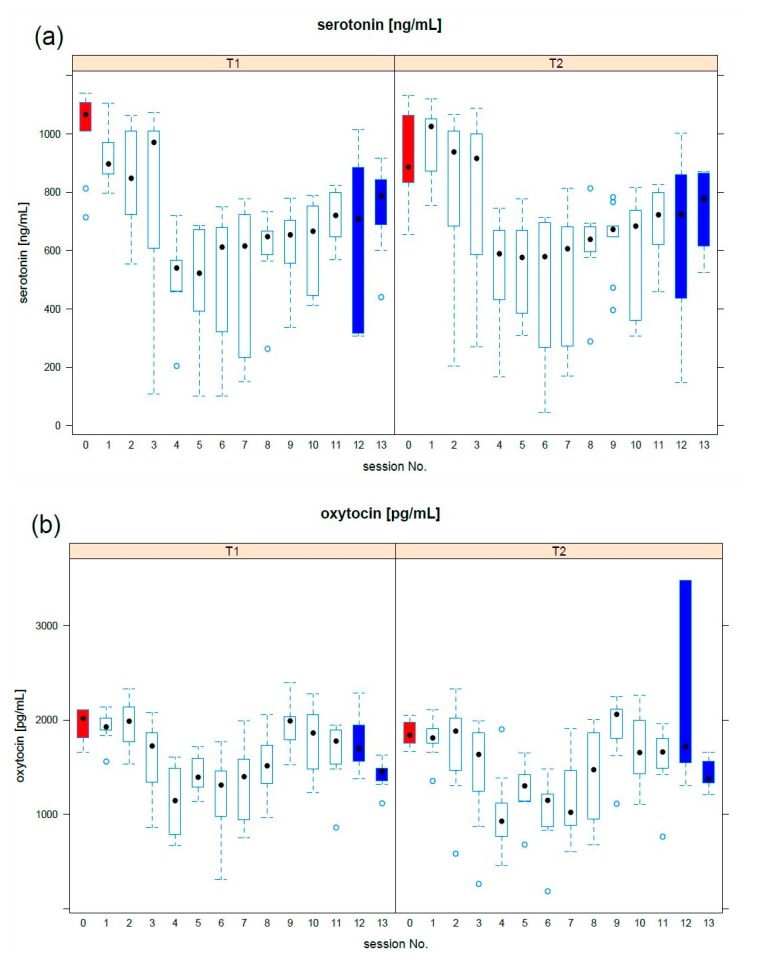
Figure 1.
Mean profiles response at T1 and T2: the boxplot of (a) serotonin, (b) oxytocin was reported per each meeting. The preliminary meeting (red) established basal levels, while the last two meetings (blue) provided information on the long-period effect. Median values are indicated by a black dot.

