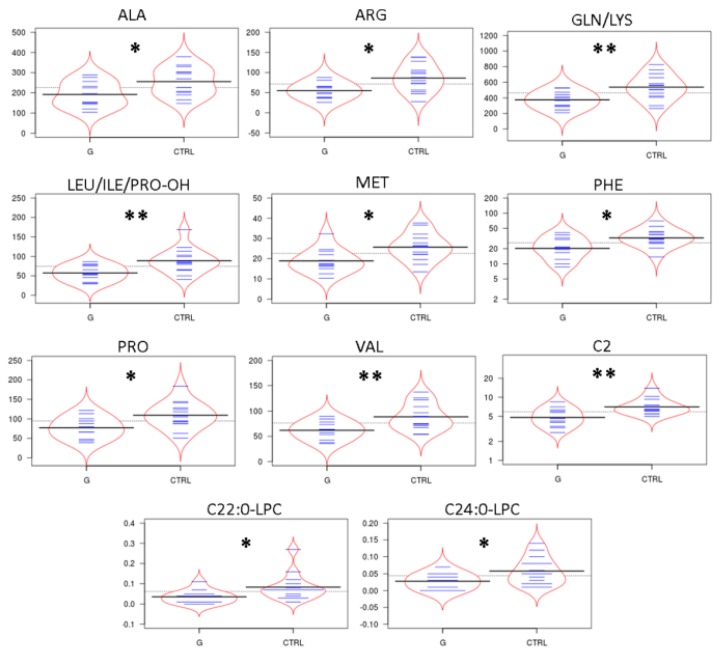
Figure 2.
In Figure 2 we report the distribution of the significantly different amino acids (AAs), acylcarnitines (ACCs) and lysophosphatidylcholine (LPCs) in the comparison between tear samples from glaucoma patients (G) versus tear samples from CTRL, visualized as the beanplots. In these plots, the polygon shape (in red line) represents the density trace computed using a log-transformation of each variable, and inside to that, a scatter plot shows all individual measurements (blue lines). * means p < 0.05, ** means p < 0.01 at the Student’s t-test and/or Mann Whitney U-test.

