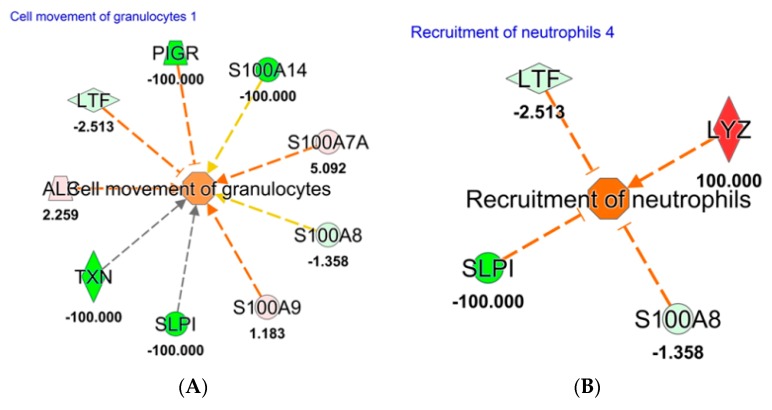
Figure 4.
Downstream analysis, using Ingenuity Pathway software, based on proteins identified and quantified in EVs sorted in POAG and CTRL tears. Red and green color indicates genes significantly increased and decreased in expression, respectively, while the number represent the fold change log. The dotted lines represent indirect relationships. Symbols used in the figure represent: Vertical rhombus, enzyme; trapezoid, transporter; circle, other; concentric circles, complex/group. (A): Cell movement of Granulocytes; (B): Recruitment of Neutrophils. Abbreviation: Polymeric immunoglobulin receptor (PIGR); Antileukoproteinase (SLPI); Thioredoxin (TXN); Albumin (ALB); Lactotransferrin (LTF); and Lysozyme C (LYZ).

