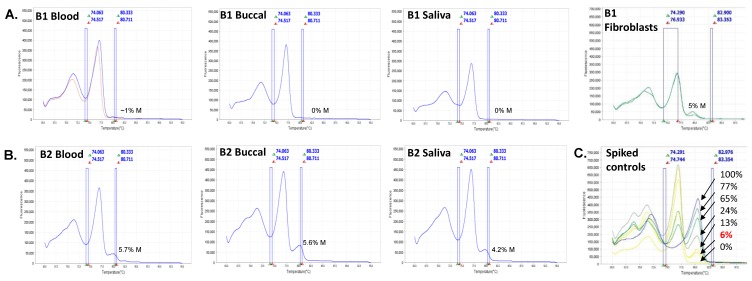
Figure 3.
Derivative curve high-resolution melt profiles and mean methylation output ratios of CpG sites located within the Fragile X-Related Epigenetic Element 2 (FREE2) region assessed using Methylation-Specific Quantitative Melt Analysis (MS-QMA) between different tissues for (A) B1 and (B) B2. (C) DNA samples from lymphoblasts of a fragile X syndrome (FXS) male with the fragile X mental retardation 1 (FMR1) promoter 100% methylated spiked with DNA from a typically developing control (cytosine-guanine-guanine (CGG) < 44) with the FMR1 promoter 0% methylated. These samples were mixed at different ratios for the MS-QMA methylation reference curve, with the expected % of methylation indicated on the plot for each derivative curve profile.

