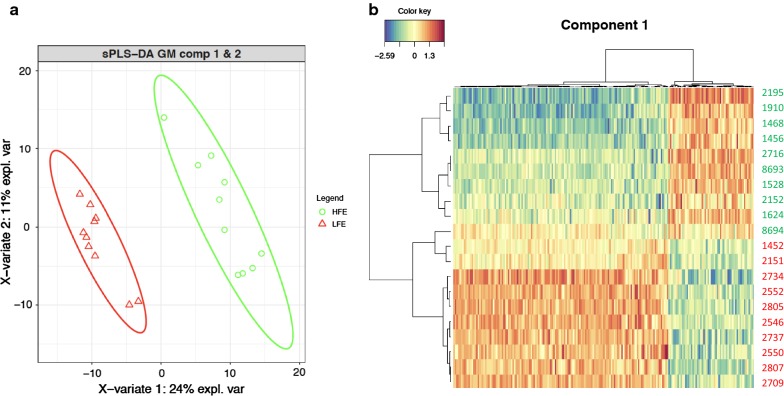
Fig. 3.
a Representation of the samples belonging to animals with high (green) and low (red) feed efficiency according to the two first components of gene expression levels obtained with the discriminant analysis performed by sPLS-DA. b Clustering of samples obtained with the 200 genes included in the first component

