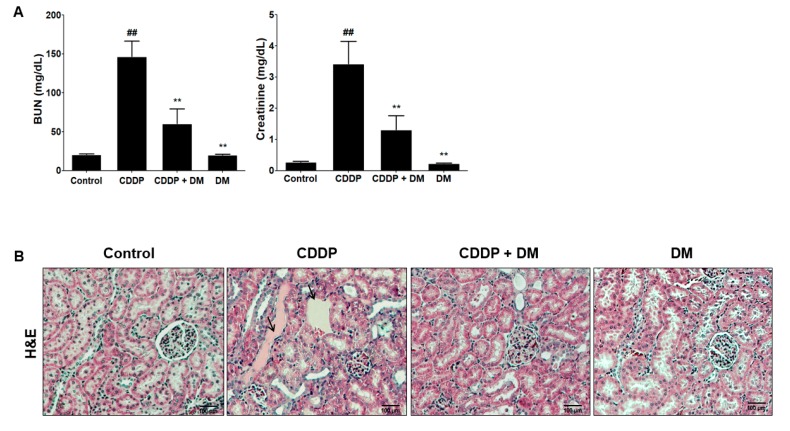
Figure 4.
Effects of DM on CDDP-induced nephrotoxicity in rats. (A) Serum biochemical parameters were measured in CDDP-treated rats. Values are the mean ± SD of six rats per group. Statistical analyses were performed using one-way ANOVA followed by Tukey’s HSD post hoc test for multiple comparisons. ## p < 0.01 compared to the control group; ** p < 0.01 compared to the CDDP-treated group. (B) H&E staining of representative kidney tissues from all experimental groups. Black arrows indicate renal tissue necrosis and infiltration in the proximal tubules. Magnification ×100.

