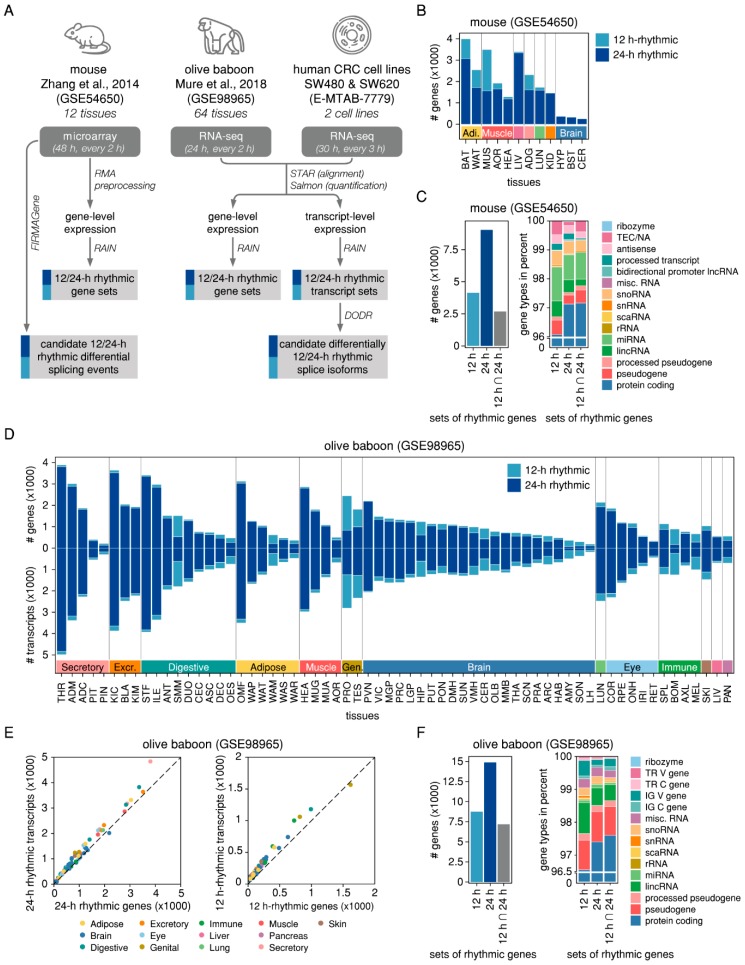
Figure 1.
Identification of 24-h and 12-h rhythmic features in nocturnal and diurnal mammalian tissues. (A) Workflow of the analysis. The input data consists of three mammalian circadian transcriptome datasets: a microarray dataset of twelve murine tissues (GSE54650), an RNA-seq dataset of 64 olive baboon tissues (GSE98965), and a novel RNA-seq dataset of two human CRC cell lines (E-MTAB-7779). For the microarray data, gene-level expression values were calculated based on RMA-preprocessed intensity values. For the RNA-seq data, sequencing reads were aligned to the transcriptome and both transcript-level and summarised gene-level abundances were estimated. 12-h and 24-h rhythmic gene and transcript sets were identified using RAIN. Candidate AS events in the microarray data were identified using FIRMAGene and candidate differentially rhythmic isoforms in the RNA-seq data were identified using DODR. (B) Number of 12-h (light blue) and 24-h rhythmic (dark blue) genes in twelve murine tissues. (C) Number of genes (left panel) and gene types in percent (right panel) for the total sets of 12-h and 24-h rhythmic genes across all murine tissues and their intersection. (E) Number of 12-h (light blue) and 24-h rhythmic (dark blue) genes (upper panel) and transcripts (lower panel) in 64 baboon tissues. Each of the baboon tissue samples is represented according to the number of 24-h rhythmic transcripts (y-axis) and the number of 24-h rhythmic genes (x-axis) (left panel) and to the number of 12-h rhythmic transcripts (y-axis) and the number of 12-h rhythmic genes (x-axis) (right panel). (F) Number of genes (left panel) and gene types in percent (right panel) for the total sets of 12-h and 24-h rhythmic genes across all baboon tissues and their intersection.

