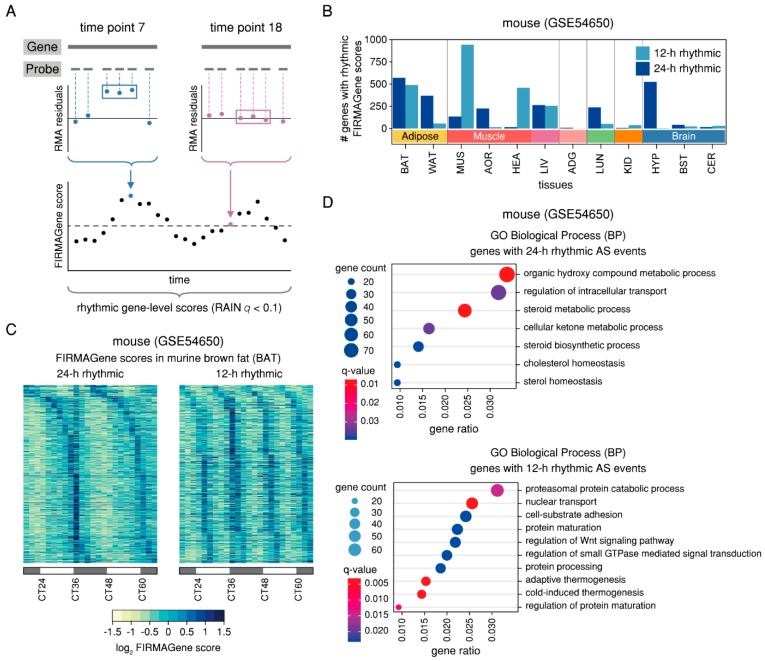
Figure 4.
Analysis of whole-transcript microarray data reveals candidate genes with 24-h and 12-h rhythmic AS events in murine tissues. (A) Schematic representation of the FIRMAGene analysis to identify candidate genes with rhythmic AS events in the murine microarray dataset. FIRMAGene uses the RMA model to decompose probe-level microarray data into probe effects and expression levels and calculates probe-wise residuals from the RMA fit. Based on the assumption that several adjacent poorly fitting probes for the same exon region that behave differently from the rest (residuals away from zero and in the same direction) can be evidence of potential AS, the algorithm scores the persistence of residuals from the RMA fit, yielding gene-level FIRMAGene scores for each individual time point. (B) Number of genes with 24-h rhythmic (dark blue) and 12-h (light blue) candidate AS events in the twelve murine tissues. (C) RAIN phase-sorted heatmaps of 24-h rhythmic (left panel) and 12-h rhythmic (right panel) FIRMAGene scores in murine brown fat (BAT). (D) Enriched GO terms (Biological Process−BP) for the sets of genes with 24-h rhythmic (upper panel) and 12-h rhythmic (lower panel) candidate AS events in the murine tissues. For genes with 12-h rhythmic AS events, only the first ten GO terms are shown. The complete lists of results can be found in Table S4.

