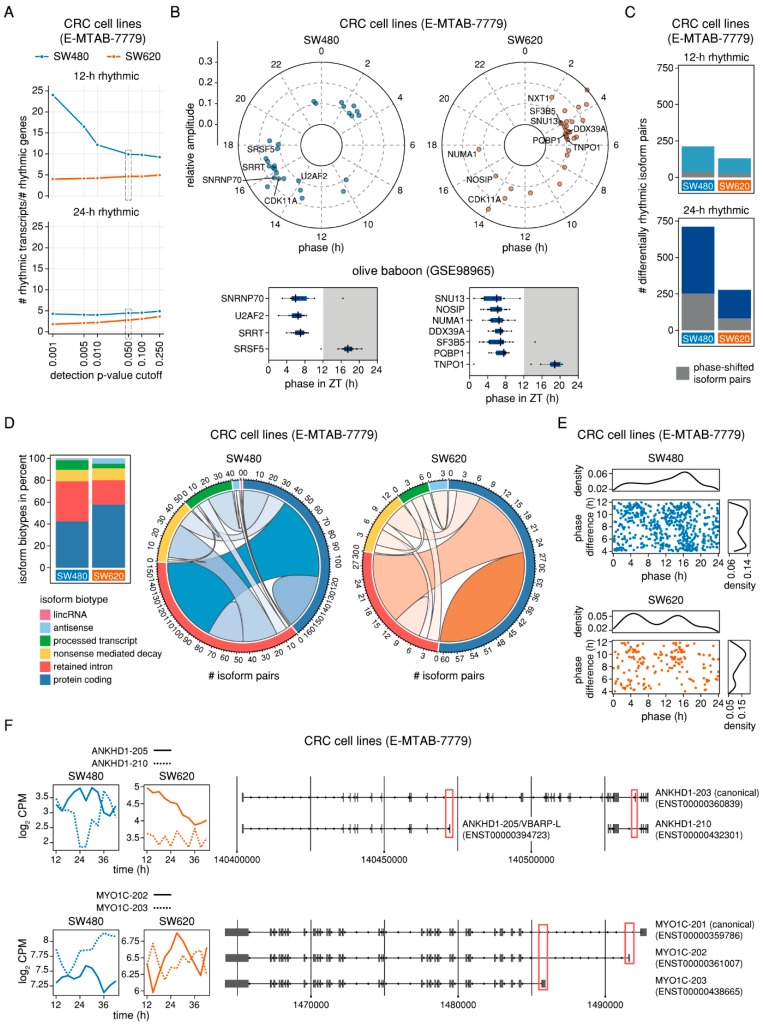
Figure 6.
Phase-shifted splice isoforms in human CRC cell lines. (A) Ratio of 12-h rhythmic (upper panel) and 24-h rhythmic (lower panel) transcripts and genes for SW480 (blue) and SW620 (orange) for different RAIN p-value cut-off levels. (B) Distribution of peak phases of 24-h rhythmic splicing-related genes in the CRC cell lines SW480 (left upper panel) and SW620 (right upper panel) and their respective orthologous genes in the baboon tissues (lower panels). Splicing-related genes that were either shared between both cell lines or for which 24-h rhythmic orthologous baboon genes were identified, are labelled by name. The grey area represents the subjective night from ZT12 to ZT24 (C) Number of 12-h (upper panel) and 24-h rhythmic (lower panel) differentially rhythmic isoform pairs in the CRC cell lines. The proportion of phase-shifted isoform pairs is marked in grey. (D) Transcript biotypes of 24-h phase-shifted isoform pairs in percent (left panel) and chord diagrams representing the types of isoform pairs for SW480 (middle panel) and SW620 (right panel). (E) Phase distribution and pairwise phase-difference of phase-shifted differentially 24-h rhythmic isoform pairs in SW480 cells (upper panel, blue) and SW620 cells (lower panel, orange). (F) Expression (log2 CPM) of the transcripts ANKHD1-205 and -210 (upper left panel) and MYO1C-202 and -203 (lower left panel) in SW480 (blue) and SW620 (orange) and visualisation of the genomic structure of ANKHD1 (upper right panel) and MYO1C transcripts (lower right panel). Differences in the exonic composition are marked with red rectangles.

