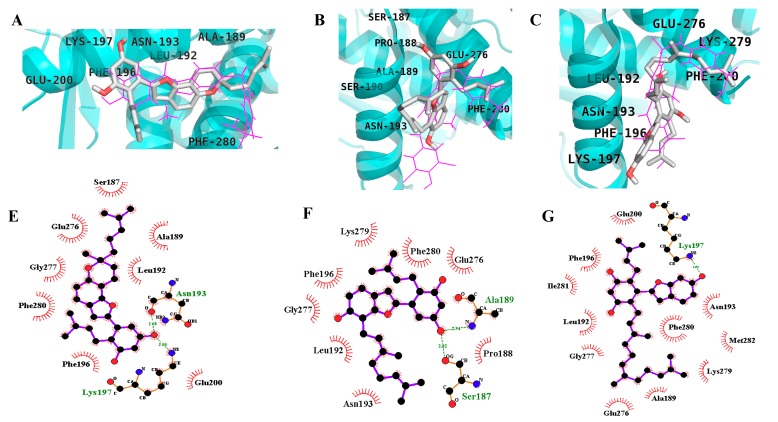
Figure 3.
Binding mode for the PTP1B allosteric site with reported inhibitor compound A (pink line) by MD2 (A), MD (B), and MB (C). 2-D ligand interaction diagram of PTP1B allosteric inhibition by MD2 (E), MD (F), and MB (G). Dashed green lines indicate H-bonds. Carbon is in black, nitrogen is in blue, and oxygen is in red.

