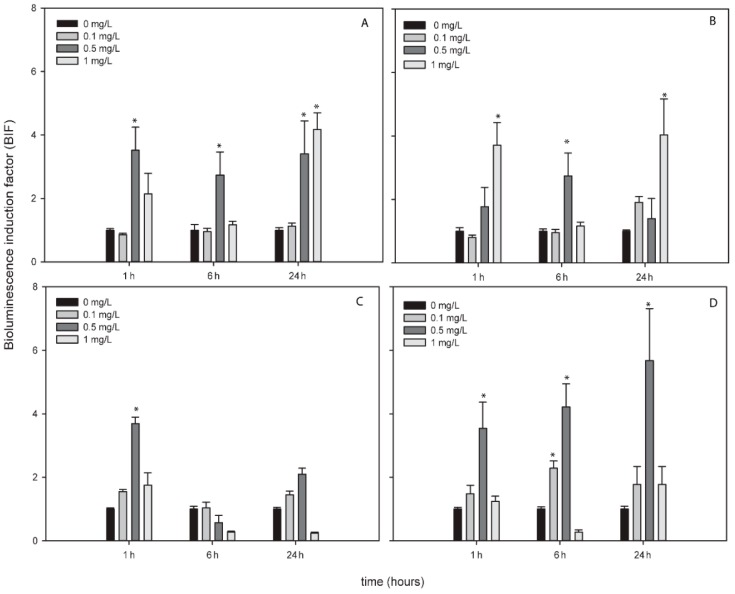
Figure 2.
Bioluminescence induction of ROS-detecting Nostoc sp. PCC7120 bioreporters exposed to 0, 0.1, 0.5 and 1 mg/L of AgNPs after 1, 6 and 24 h of exposure. (A) Nostoc sp. PCC7120 pBG2154, (B) Nostoc sp. PCC7120 pBG2165, (C) Nostoc sp. PCC7120 pBG2172 and (D) Nostoc sp. PCC7120 pBG2173. The asterisks indicate statistically significant differences with respect to the control (unexposed cells) (ANOVA p < 0.05).

