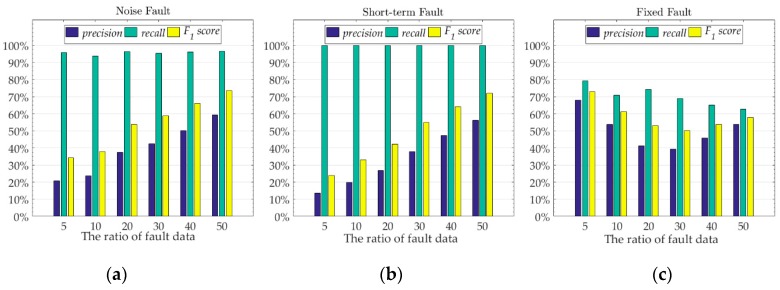
Figure 9.
The fault detection performance of the model under different fault data ratios for three different fault. (a) noise fault, (b) short-term fault, (c) fixed fault. The value of the x-axis is the ratio of the number of fault data we add to the original sample to the total number of original sample data.

