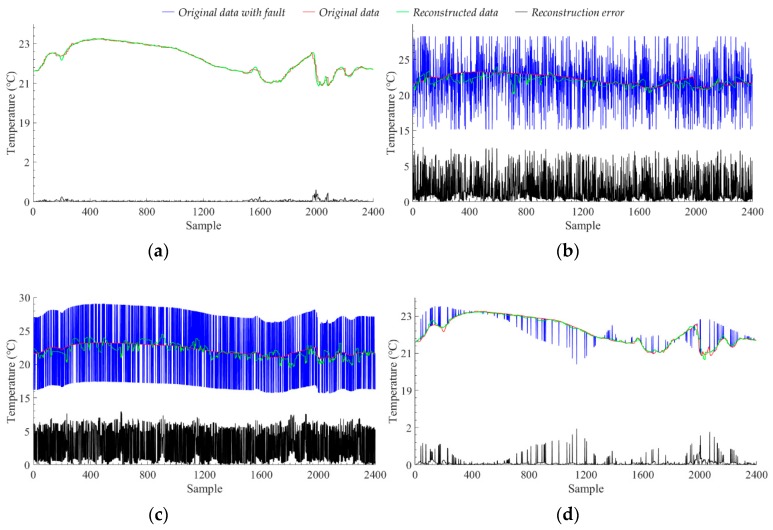
Figure 10.
The data reconstruction results of the model for different data faults. (a) The original data without fault, (b) The original data with noise fault and the ratio of fault data is 50%, (c) The original data with short-term fault and the ratio of fault data is 50%, (d) The original data with fixed fault and the ratio of fault data is 5%.

