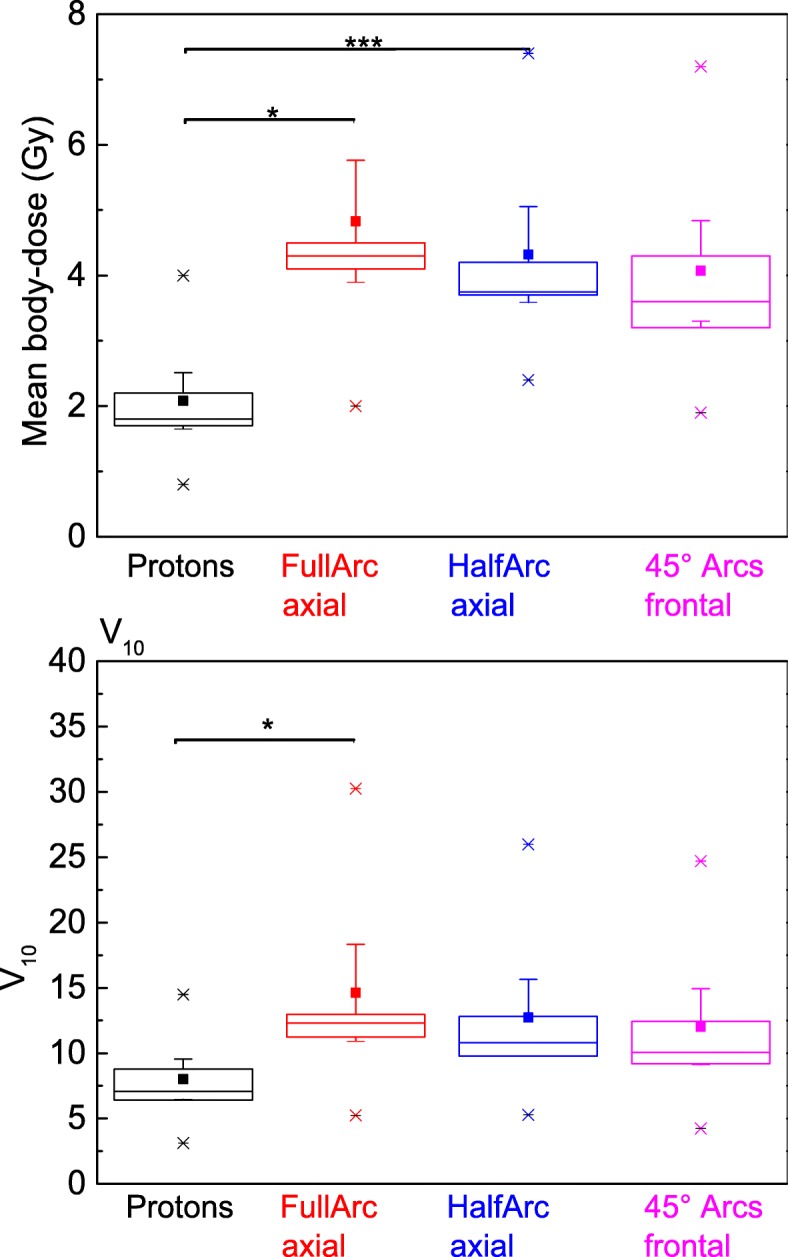
Fig. 8.

V10 and mean body dose for the body compartment between the fourth cerebral and the first lumbar vertebrae. As well median (line) as mean (square) doses are lower by the factor of 2–3 when comparing photon-RT-techniques with the proton-RT-technique. (Statistics: Kruskal-Wallis ANOVA with pairwise comparisons. Significance p = 0.025 for difference in V10 protons versus Full-ARC- RT, p = 0.017 for mean-dose protons versus FullArc-RT and p < 0.001 for protons versus Half-ARC-RT)
