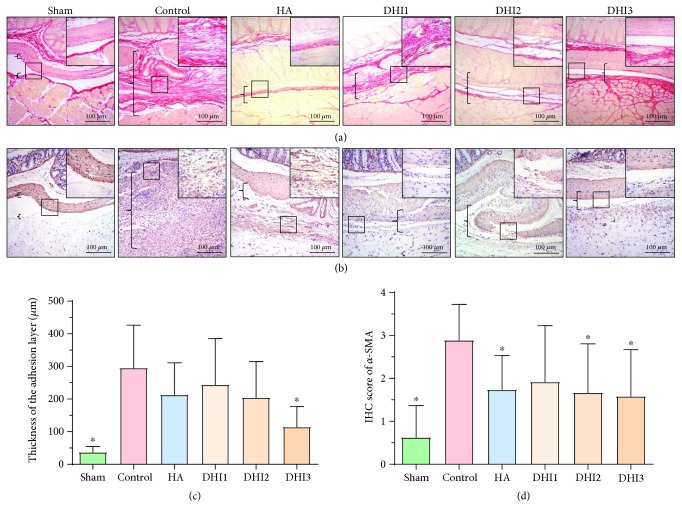
Figure 3.
DHI treatment attenuated collagen deposition in the adhesion tissue of the rat model 7 days after operation (n = 8; compared with the control group, ∗P < 0.05 and ∗∗P < 0.01). (a) Sirius red picric acid staining of each group at 100x magnification. The top right corner is shown at 200x magnification. The brackets indicate tissue in the adhesion area. (b) α-SMA staining of each group at 100x magnification. The top right corner is shown at 200x magnification. The brackets indicate tissue in the adhesion area. (c) Adhesion thickness in each group as assessed by Sirius red picric acid staining (compared with the control group, ∗P < 0.05, abnormal distribution, Kruskal-Wallis test). (d) α-SMA staining scores of each group (compared with the control group, ∗P < 0.05, normal distribution, one-way ANOVA).

