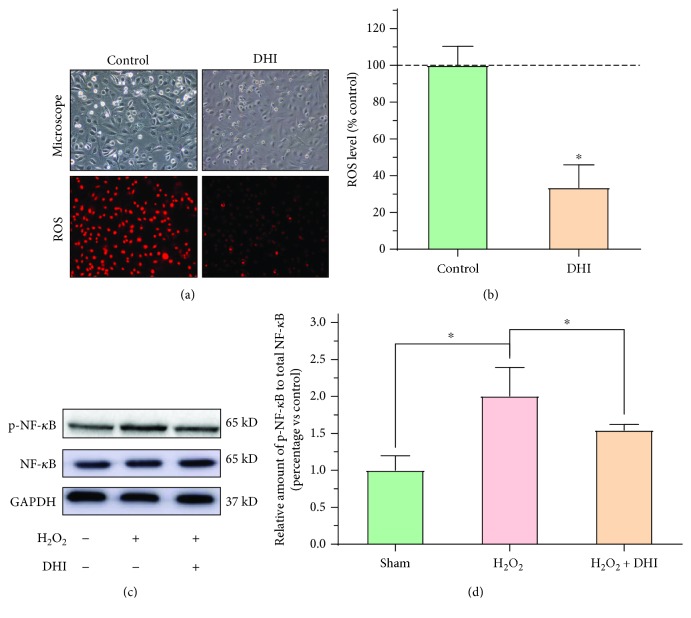
Figure 6.
DHI treatment reduces oxidative stress in RPMCs (compared with the control group, ∗P < 0.05 and ∗∗P < 0.01). (a) Representative cellular morphology and ROS expression in DHI-treated and control cells at 100x magnification. (b) The ROS level in DHI-treated and control cells (compared with the control group, ∗P < 0.05, normal distribution, t test). (c) Western blot detection of NF-κB and phosphorylated NF-κB expression in the different DHI- and H2O2-treated groups. (d) The ratio of the relative expression of phosphorylated NF-κB to total NF-κB in each group (compared with the control group, ∗P < 0.05, ∗∗P < 0.01, normal distribution, one-way ANOVA).

