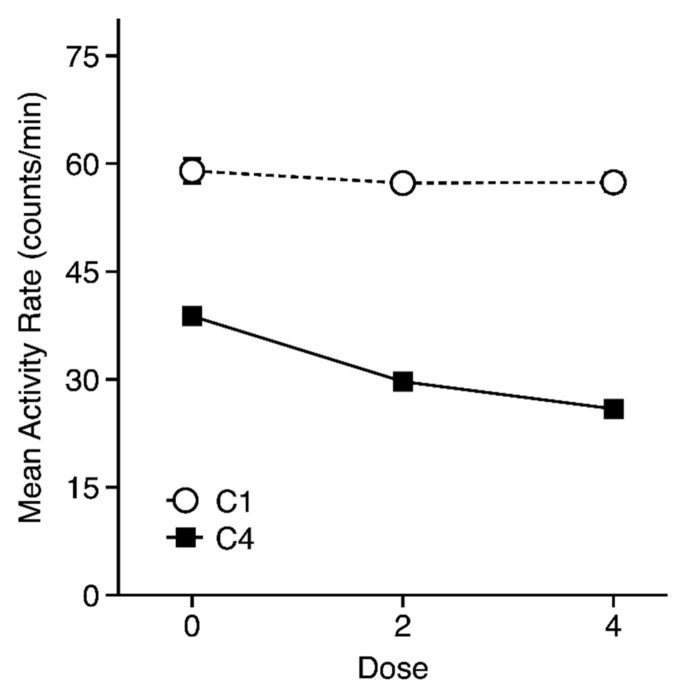
Figure 2.
Mean activity rates (±SEM) in each dose group during the first (C1: Open symbols) and last (C4: Closed symbols) conditioning trials. Data are collapsed over strain, conditioning subgroup, and trial type. Each point for the 0-g/kg group includes 171 mice, while each point for the ethanol-injected groups includes 338–343 mice.

