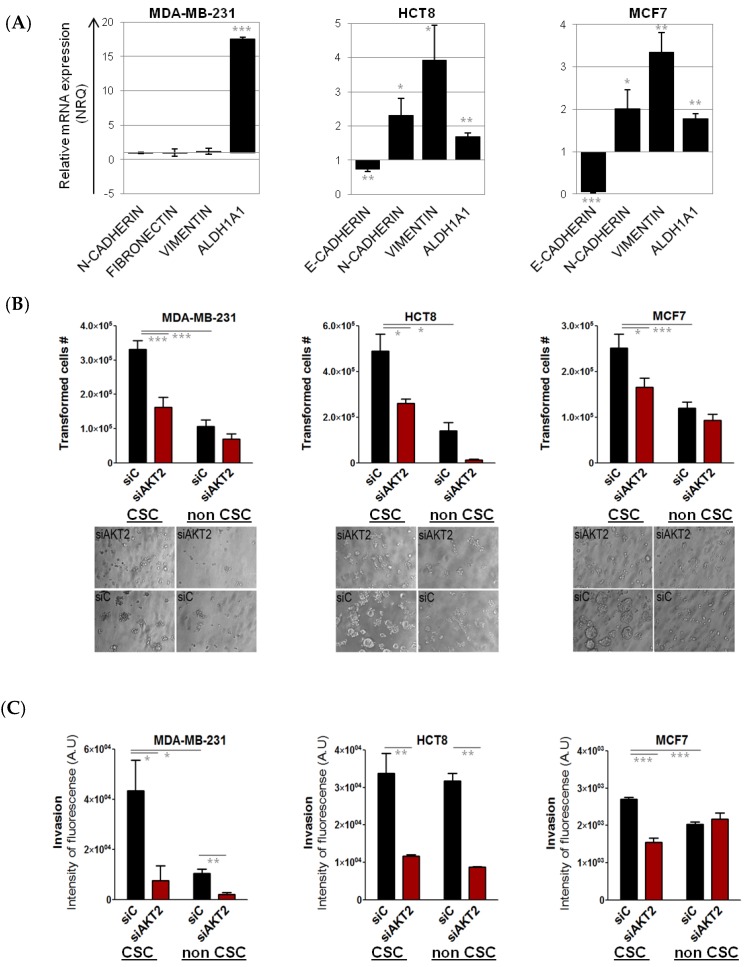
Figure 6.
Effects of AKT2 silencing in MDA-MB-231, HCT-8, and MCF-7 CSC. MDA-MB-231, HCT-8, and MCF-7 CSC were separated from non-CSCs and the relative EMT gene expression profile was quantified by qPCR. The presented values are relative to their non-CSC population (A). Anchorage-independent growth assay: The graph represents the number of cells capable of anchorage-independent growth, comparing CSCs and non-CSC transfected with siAKT2 and control siRNA (siC). Images are photographs of colonies formed after seven days of incubation with siAKT2 and siC (B). Invasion assay: The graph represents the number of cells that demonstrated invasive capacity comparing CSC and non-CSC transfected with siAKT2 and siC (C). Results are expressed as NRQ (relative normalized quantities) mean ± SEM (n ≥ 3); (* p < 0.05; ** p < 0.01, *** p < 0.001).

