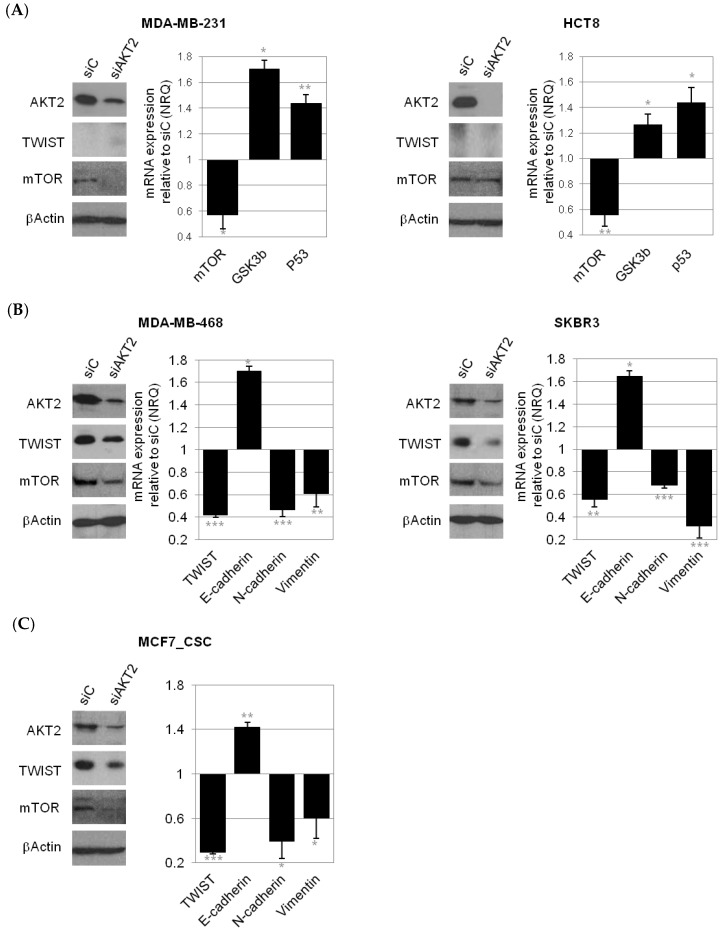
Figure 7.
AKT2 silencing on gene expression. qPCR quantification of gene expression levels of key regulators in the mTOR signaling pathway in cells that do not express TWIST (MDA-MB-231, HCT8; (A) and epithelial-to-mesenchymal transition (EMT) signaling pathway in mesenchymal cells that do express TWIST (MDA-MB-468, SKBR3; (B) and (MCF-7 CSC) after the treatment with siAKT2 (C). The presented values are relative to cells transfected with siC and are expressed as NRQ (relative normalized quantities) mean ± SEM (n ≥ 3); (* p < 0.05; ** p < 0.01, *** p < 0.001).

