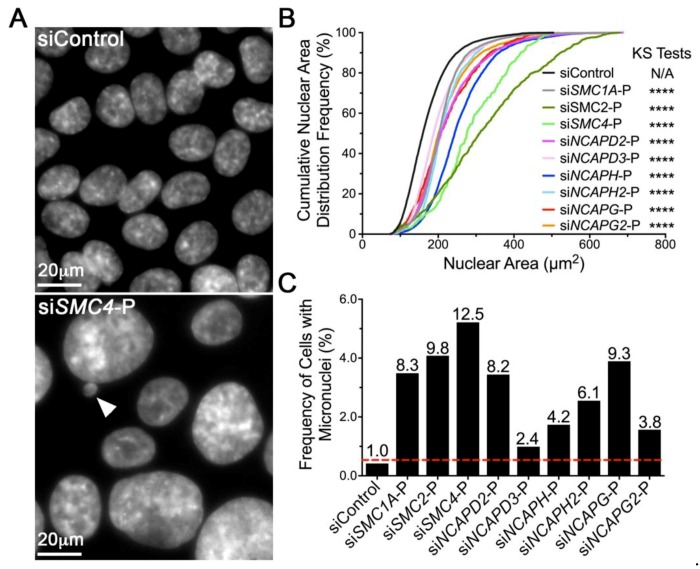
Figure 2.
Reduced condensin gene expression induces significant changes in NAs and MN formation in HCT116. (A) Representative micrographs depicting visual differences in NAs and MN formation (arrowhead) following condensin gene silencing using siRNA pools (-P) relative to siControl. Note the scale bars are identical. (B) Cumulative NA distribution frequencies following condensin gene silencing relative to siControl (black). Kolmogorov-Smirnov (KS) tests reveal statistically significant increases in NA distributions (rightward shift) following silencing relative to siControl (N/A, not applicable; ****, p < 0.0001). (C) Column graph presenting the mean frequency of cells with micronuclei following silencing, with the mean fold increase (relative to siControl) indicated above each column. The red dashed line identifies the minimum threshold (mean + 2 standard deviations of siControl) required to be considered a significant increase in MN formation.

