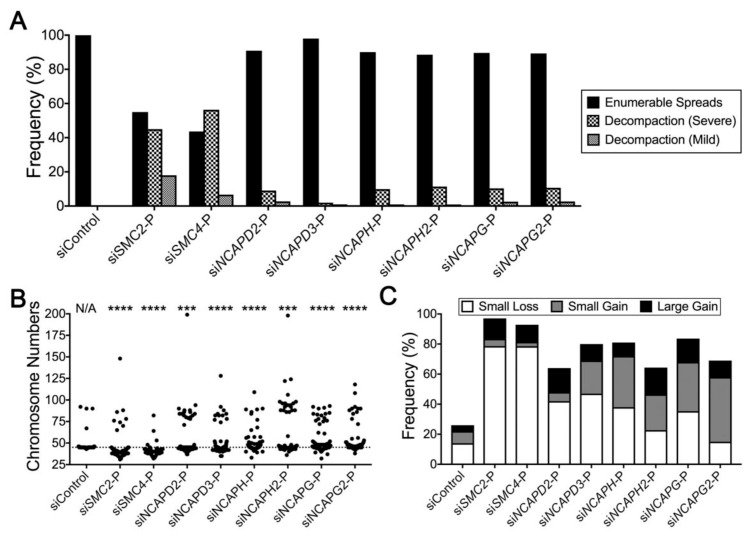
Figure 4.
Reduced condensin gene expression induces aberrant numerical and decompaction phenotypes in HCT116. (A) Bar graph presenting the frequency of enumerable and chromosome decompaction phenotypes (severe and mild) following gene silencing. (B) Dot plot depicting an overall increase in chromosome number heterogeneity following condensin gene silencing relative to siControl. The horizontal line identifies the modal chromosome number of HCT116. KS tests reveal statistically significant differences in the cumulative distribution frequencies of chromosome numbers relative to siControl (***, p < 0.001; ****, p < 0.0001). (C) Bar graph depicting overall increases in the frequency of aberrant chromosome numbers following condensin gene silencing.

