. 2019 Sep 3;8:e42542. doi: 10.7554/eLife.42542

Figure 3. Associations between amino acid variables at position 2224 of NS5A, rs12979860 genotypes and HCV viral load in the group of patients infected with HCV genotype 1b.

(A) Boxplot of transformed viral load stratified by amino acids present at position 2224 of NS5A. (B): Boxplot of transformed viral load stratified by rs12979860 genotypes (CC, CT, TT) and by presence or absence of leucine at position 2224 of NS5A.

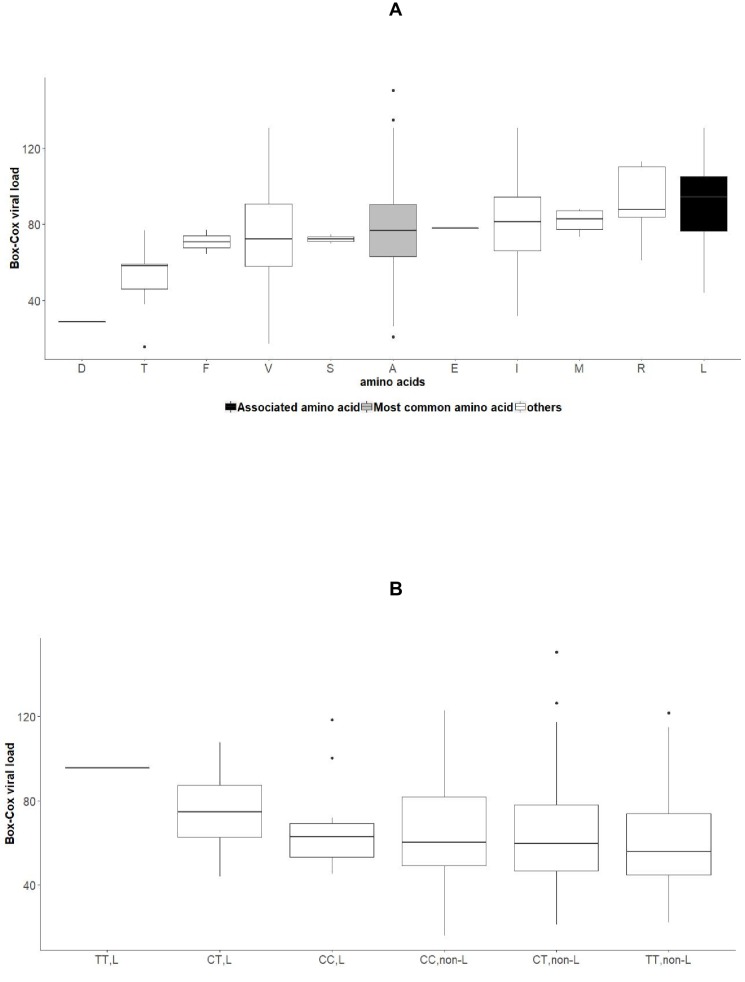
Figure 3.

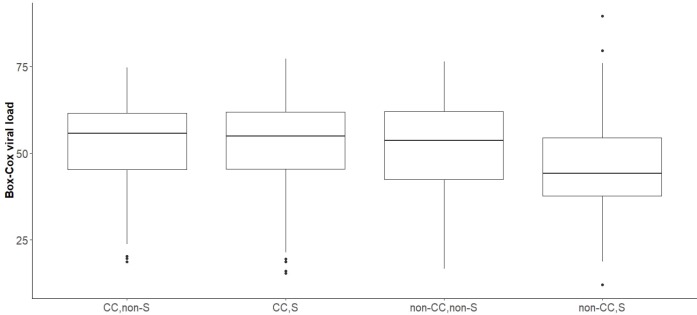
Figure 3—figure supplement 1. Boxplot of transformed viral load stratified by rs12979860 genotypes (CC, CT, TT) in samples infected with viral genotype 3a, whose virus carries Serine at position 2414.

Figure 3—figure supplement 1.

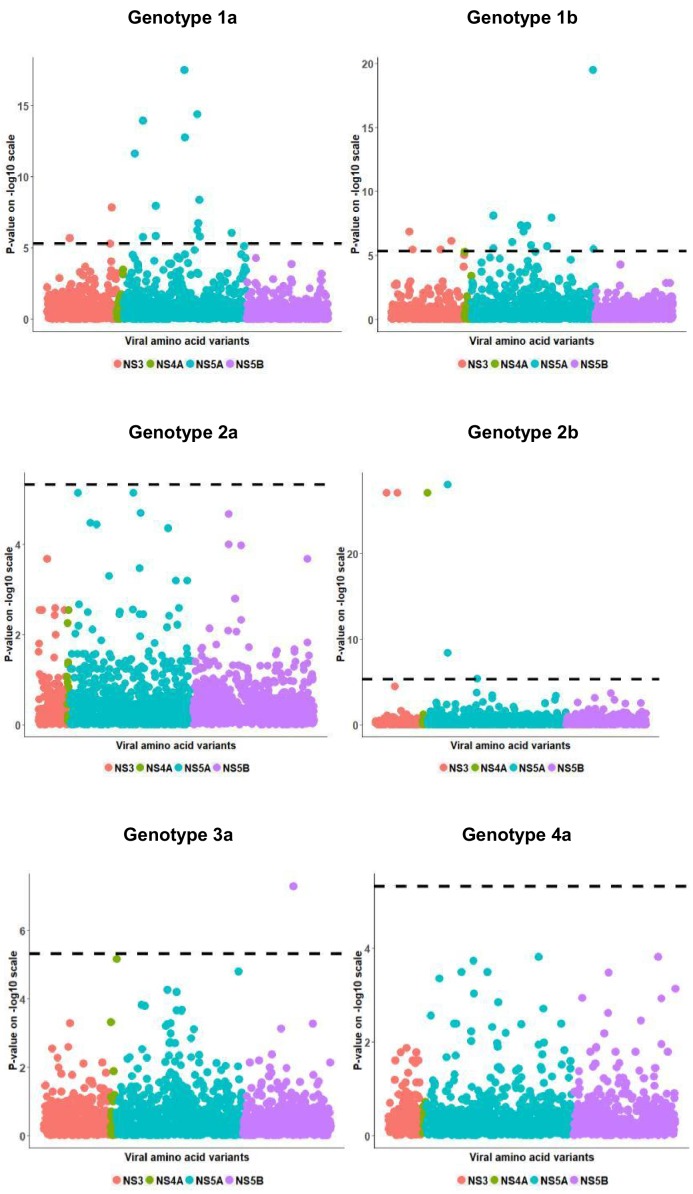
Figure 3—figure supplement 2. Per genotype viral load residual analysis results.

Figure 3—figure supplement 2.

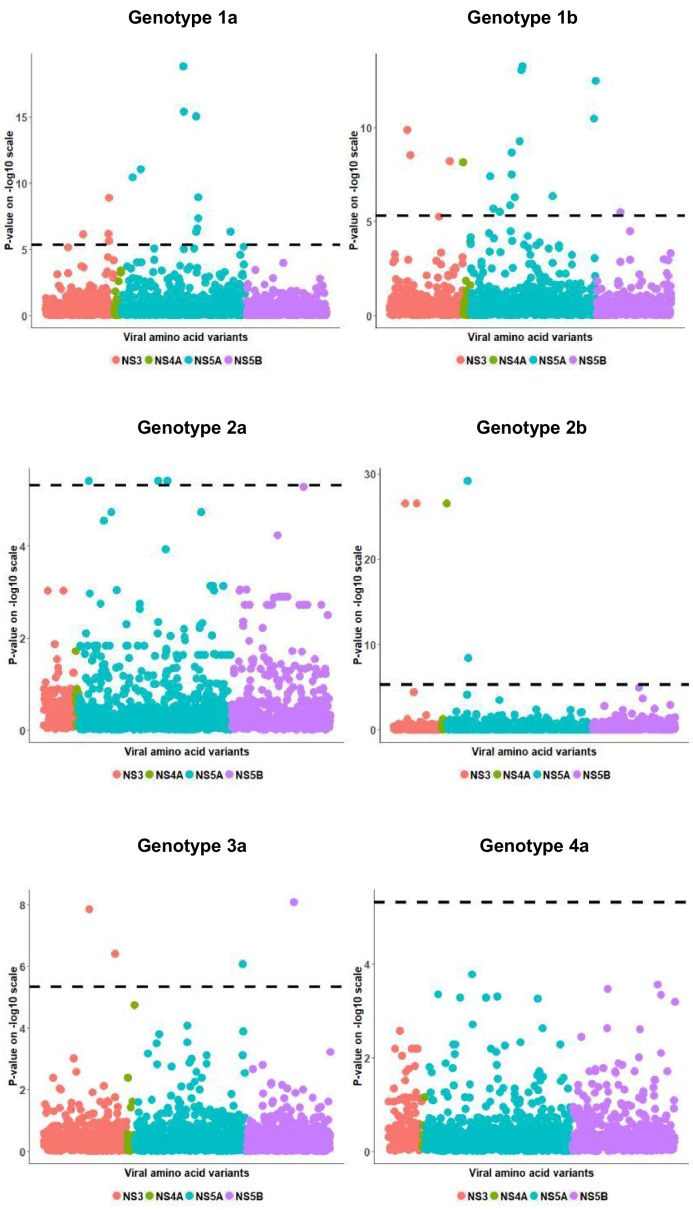
Manhattan plot for associations between viral load residual and HCV amino acid variants. The dotted line shows the Bonferroni-corrected significance threshold.
Figure 3—figure supplement 3. Per genotype integrated association analysis results in the European subgroup.

Figure 3—figure supplement 3.

Manhattan plot for associations between human SNP rs12979860 and HCV amino acid variants. The dotted line shows the Bonferroni-corrected significance threshold.
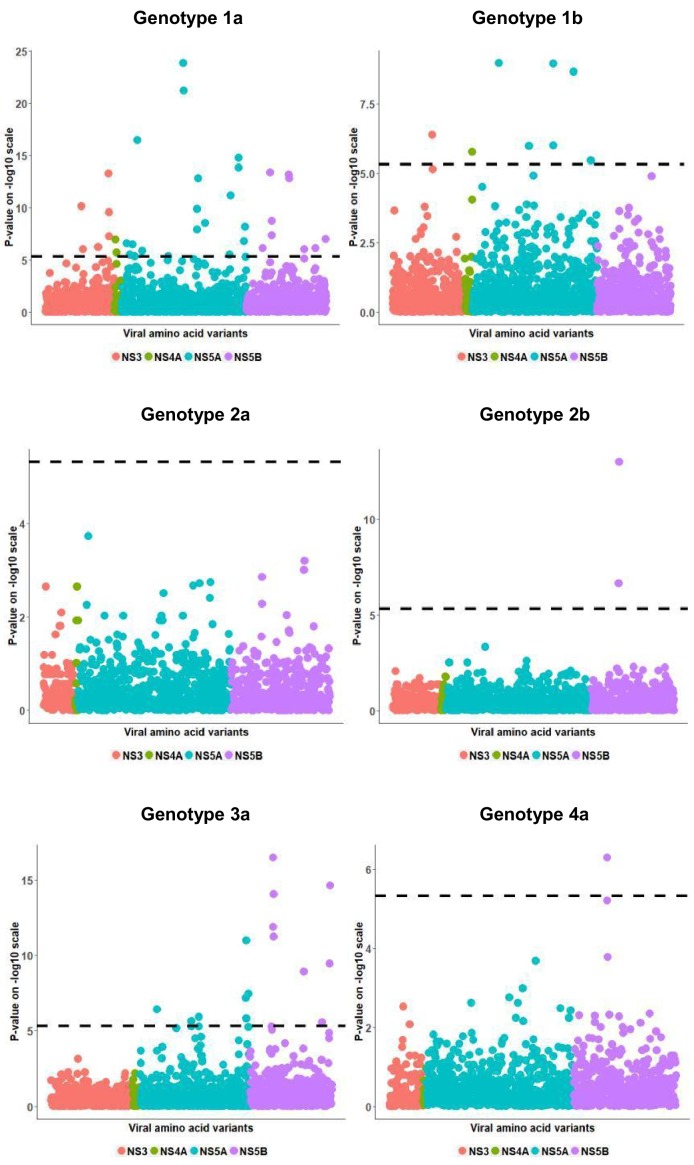
Figure 3—figure supplement 4. European per genotype viral load GWAS analysis results.

Figure 3—figure supplement 4.

Manhattan plot for associations between human Box-Cox transformed pre-treatment viral load and HCV amino acid variants. The dotted line shows the Bonferroni-corrected significance threshold.
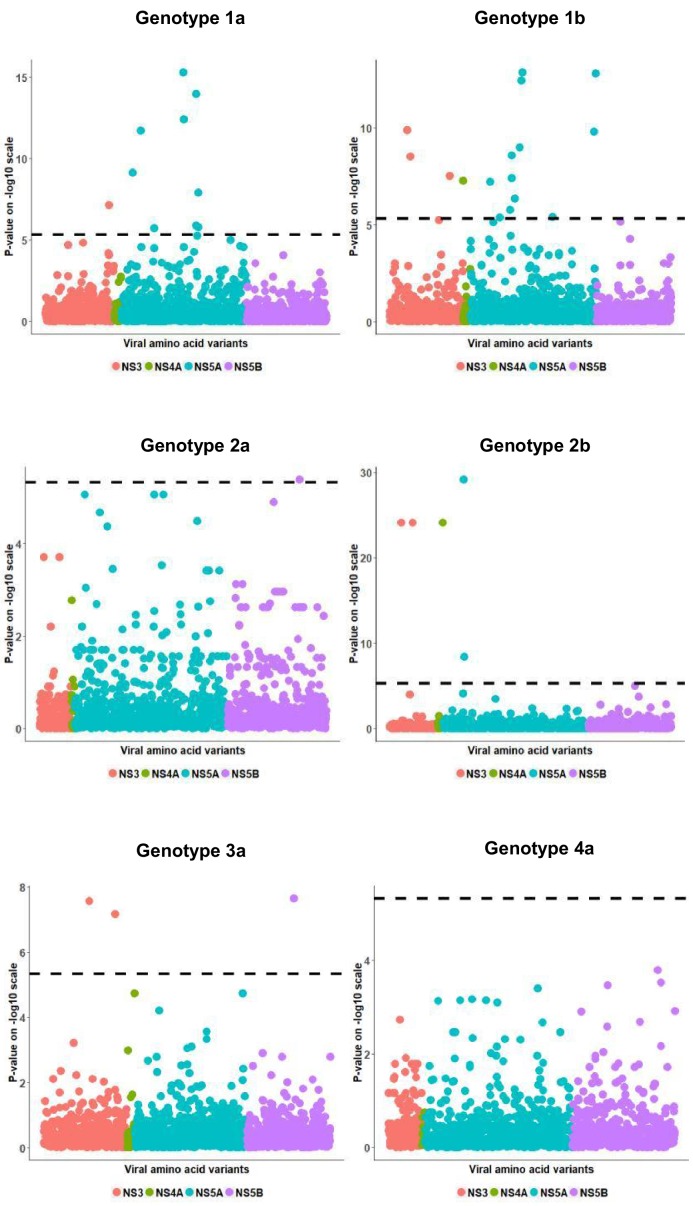
Figure 3—figure supplement 5. European per genotype viral load residual GWAS analysis results.

Figure 3—figure supplement 5.

Manhattan plot for associations between viral load residual and HCV amino acid variants. The dotted line shows the Bonferroni-corrected significance threshold.