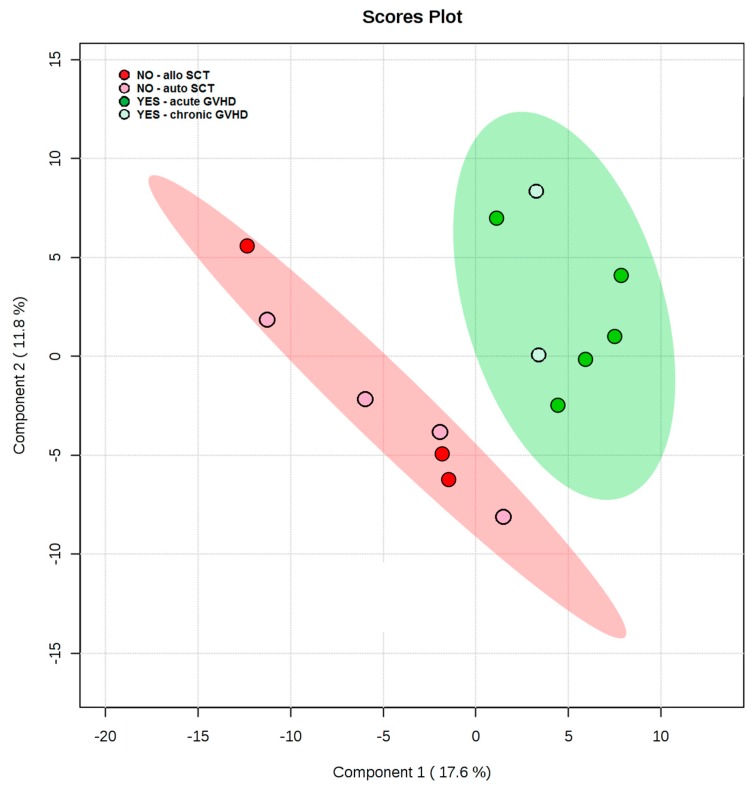
Figure 2.
Supervised method PLS-DA identified the direction of maximum covariance between the data et and the class membership, extracting features in the form of latent variables. The model separation of GVHD (YES) and no-GVHD (NO) pre-transplant indicates metabolic differences for prediction of GVHD phenomena with no overlap in the 95% confidence intervals (shaded areas). In the NO group, the allogeneic donor type (allo SCT) is indicated by the red circle, and the autologous donor type (auto SCT) is indicated by pink circles. In the YES group, acute GVHD is indicated by the dark green circle, and the chronic GVHD is indicated by the light green circle.

