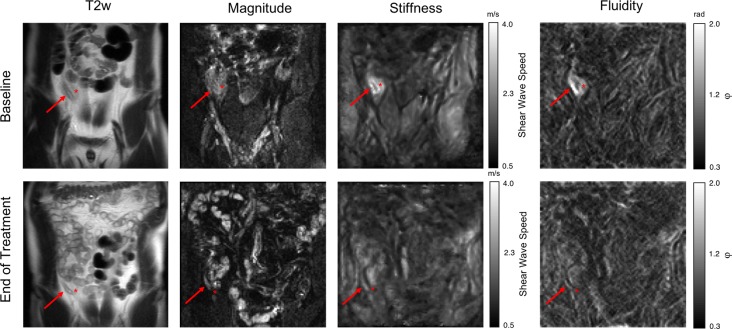
Figure 3.
Coronal T2 weighted (T2w), magnitude, stiffness and fluidity images of the appendix (arrow) in grey scale at baseline (top row) and at the end of antibiotic treatment (bottom row). At baseline, the inflammatory appendix (arrow) and the surrounding tissue (asterisk) were significantly stiffer and more fluid than after antibiotic treatment. Inflammatory areas in stiffness and fluidity maps are demarcated with higher contrast from surrounding healthy soft tissue compared with T2w images, allowing a clear identification of the extent of inflammatory involvement. Grey scale for stiffness: bright=stiff, dark=soft; grey scale for fluidity: bright=high fluidity, dark=low fluidity.

