Figure 2.
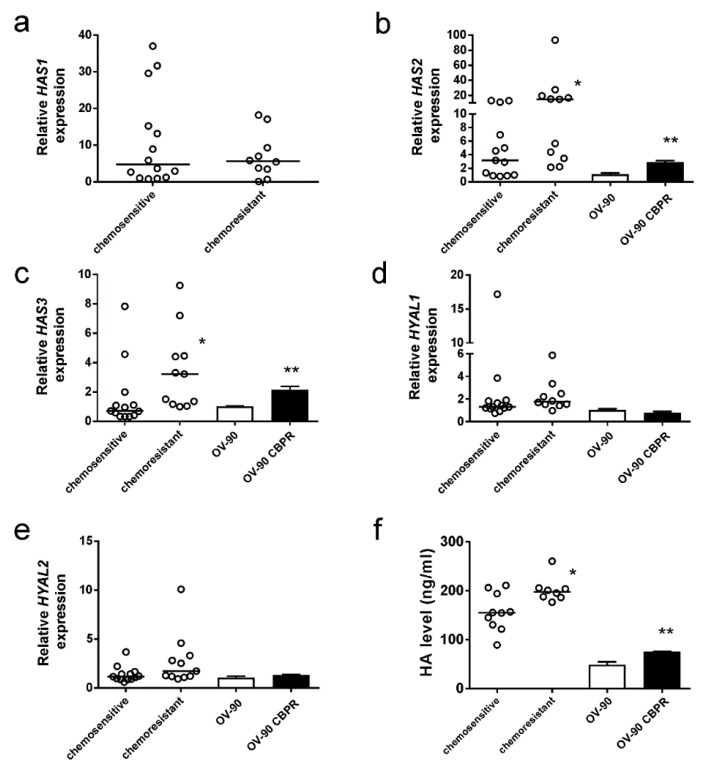
Hyaluonan (HA) synthase and hyaluronidase expression and HA production in chemosensitive and chemoresistant serous ovarian cancer cells. Expression in chemotherapy-resistant primary serous ovarian cancer cells compared to chemotherapy-sensitive cells and OV-90 cells made resistant to carboplatin (OV-90 CBPR). HAS1 (a), HAS2 (b) HAS3 (c), HYAL1 (d), and HYAL2 (e) *, HAS2 (p = 0.0218, Mann Whitney U test) and HAS3 (p = 0.0107, Mann Whitney U test) but not HAS1 expression (p = 0.879, Mann Whitney U test) was significantly increased in chemoresistant cells compared to chemosensitive cells. **, HAS2 (p = 0.021, Student t test) and HAS3 (p < 0.0001, Student t test) were significantly increased in OV-90 CBPR compared to parental cells. HYAL1 and HYAL2 expression was not significantly different between the chemosensitive and chemoresistant primary cancer cells nor the OV-90 cell lines. The bars for the primary cells specify the median values in each group and are expressed as the mean fold change from RNA samples (n = 6–9) from three independent experiments. Data for OV-90 cells are expressed as the mean fold change ± SEM from 7–12 individual RNA samples from 2–3 independent experiments. (f) HA levels measured by ELISA assay in conditioned media. *, significantly increased in primary chemoresistant (n = 8) compared to chemosensitive (n = 10) serous ovarian cancer cells (p = 0.043, Mann Whitney U test). **, significantly increased in OV-90 CBPR conditioned media compared to parental cells (p = 0.0227, Mann Whitney U test).

