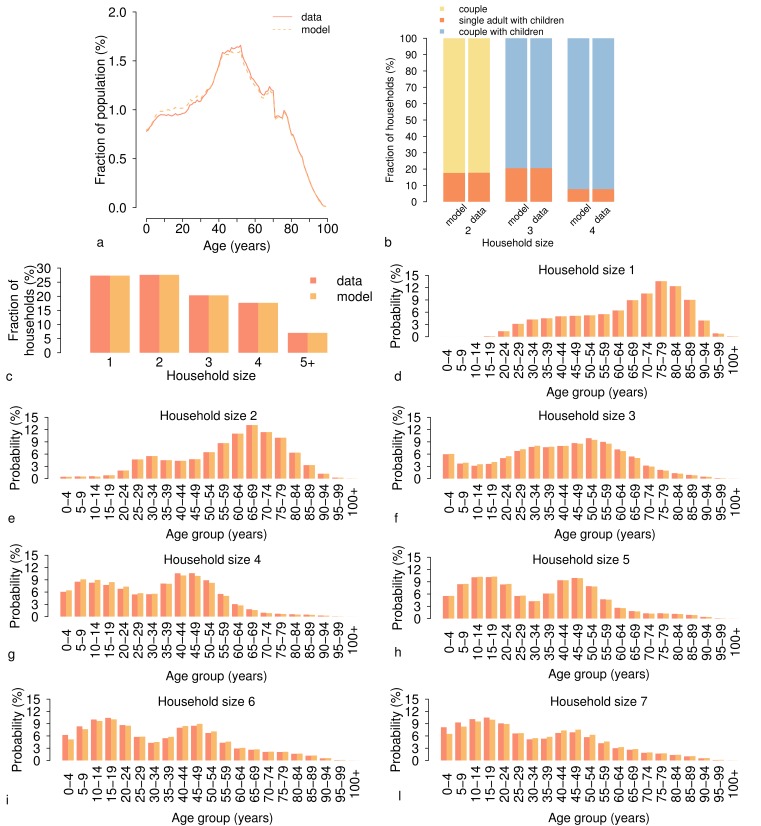
Appendix 1—figure 1. Age distribution and household structure of the Italian population in the year 2017.
(a) Age distribution of the Italian population as simulated by the model (dotted line) and as reported by the Italian National Institute of Statistics (solid line) for 2017 (Italian National Institute of Statistics, 2018). (b) Fraction of households of different type (%) as simulated by the model and as observed in the census data (Statistical Office of the European Commission, 2011) for different household sizes. (c) Fraction of households by size (%) as simulated by the model and as observed in census data (Statistical Office of the European Commission, 2011). (d-l) Age distribution of household members by household size h∈{1,…,7} as simulated by the model and as observed in census data (Statistical Office of the European Commission, 2011).

