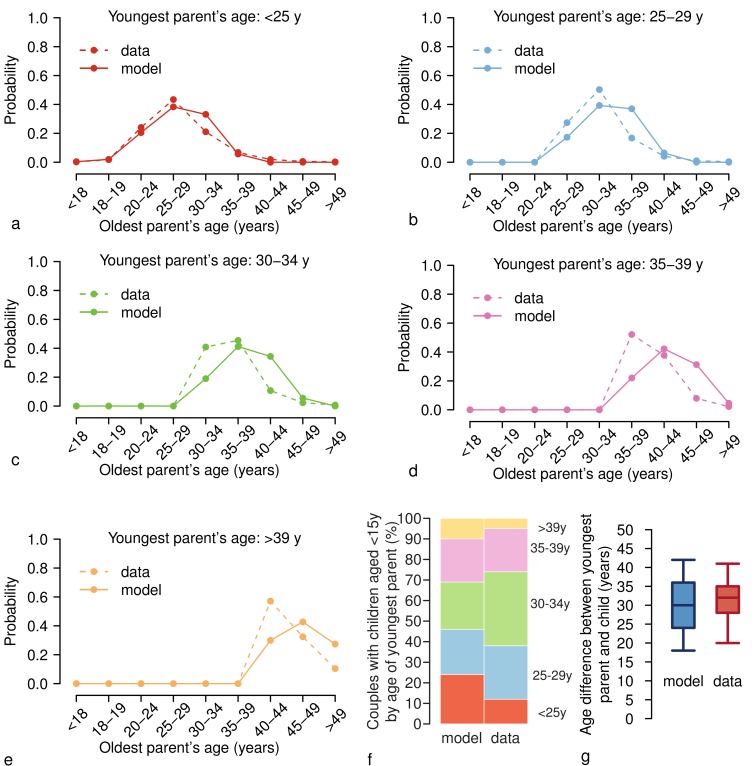
Appendix 1—figure 2. Age differences between household members.
(a) Age distribution of the oldest parent in households in which the youngest parent is less than 25 years old as simulated by the model (solid line) and as observed in the census data (dotted line) (Statistical Office of the European Commission, 2011). (b-e) As (a) but for households in which the youngest parent is aged (b) 25–29 years, (c) 30–34 years, (d) 35–39 years, and (e) > 39 years. (f) Simulated and observed fractions of couples (%) with children younger than 15 years disaggregated by age of the youngest parent. (g) Boxplots (percentiles: 2.5, 25, 50, 75, and 97.5) of the age difference between the youngest parents and their children as simulated by the model (blue) and as observed in the census data (red) (Statistical Office of the European Commission, 2011).

