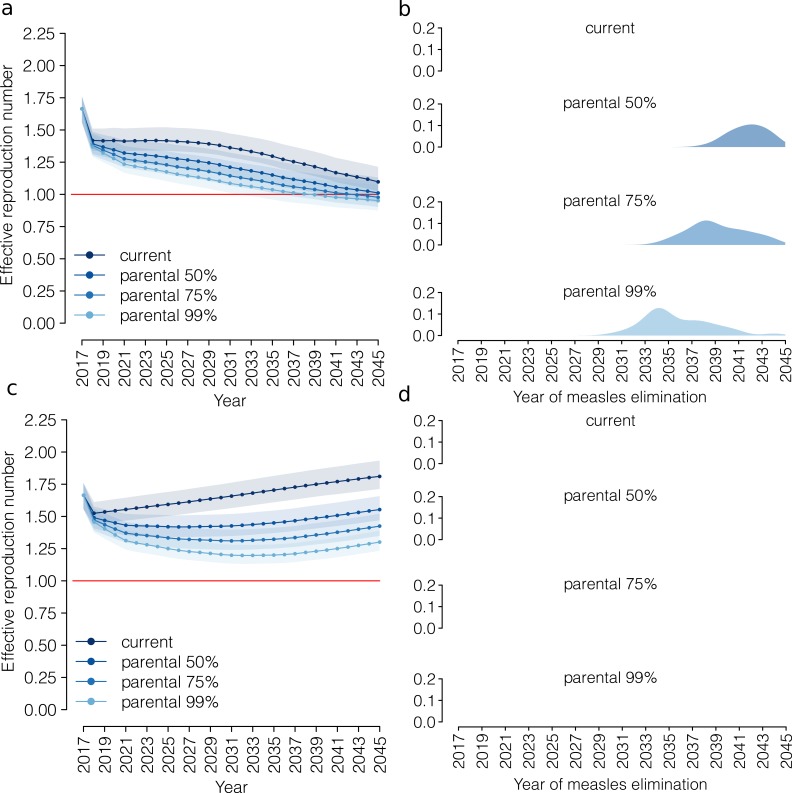
Appendix 1—figure 9. Future trends in measles elimination: population mixing.
(a) Mean effective reproduction number over time, as estimated by the model under the ‘current’ vaccination program and under different coverage scenarios for the ‘parental vaccination’ program when assuming contact matrices estimated by Fumanelli et al. (2012). Shaded areas represent 95% CI associated with model estimates. The red line represents the measles elimination threshold; elimination is achieved when the effective reproductive number is smaller than 1. (b) Probability associated with different time at measles elimination, as obtained from 1000 model realizations under the ‘current’ vaccination program and under different coverage scenarios for the ‘parental vaccination’ when assuming contact matrices as estimated by Fumanelli et al. (2012). (c) As (a) but when assuming homogeneous mixing in the population. (d) As (b) but when assuming homogeneous mixing in the population.

