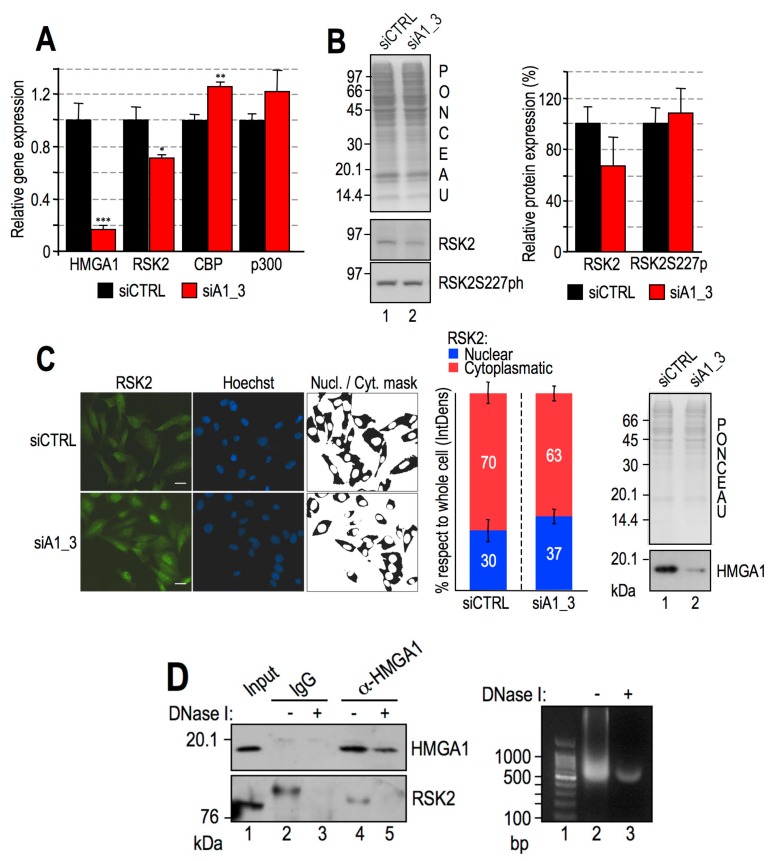
Figure 8.
High Mobility Group A1 (HMGA1) modulates histone post-translational modifications (PTMs) acting downstream of Ribosomal protein S6 kinase alpha-3 (RSK2) phosphorylation. (A) Relative gene expression data regarding HMGA1, RSK2, CBP, and p300 obtained by reverse transcription-quantitative polymerase chain reaction (RT-qPCR) analyses of MDA-MB-231 samples treated with siCTRL or siA1_3. Mean and standard deviation (n = 3) are reported relative to the control sample. Glyceraldehydes-3-phosphate dehydrogenase (GAPDH) was used as an internal reference gene. Significance was assigned by Student’s t-test (*: p < 0.05; **: p < 0.01; ***: p < 0.001). (B) Western blot (WB) analysis of MDA-MB-231 lysates upon HMGA1 silencing (lane 2, siA1_3) or control (lane 1, siCTRL). Panels are representative of a biological triplicate, and the red ponceau-stained membrane is shown as a loading and quantification control. HMGA1 levels have been previously verified (see Figure 1). The histogram graph displays WB band densitometry values normalized to red ponceau-stained lysate lanes and relative to control samples. Mean and standard deviations (n = 3) are reported. Significance was assigned by Student’s t-test. (C) Immunofluorescence analysis performed with MDA-MB-231 cells treated with control siRNA (siCTRL) and with siRNA targeting HMGA1 (siA1_3). Representative fields are shown. Staining: RSK2 (green), DNA (Hoechst, blue). The nuclear/cytoplasm mask is reported. Results are shown as percentages of integrated densities (IntDens) of each area (nucleus or cytoplasm) with respect to the whole cell integrated density and reported as a mean of three different regions of interest for each sample type (siCTRL or siA1_3). The efficiency of HMGA1 silencing has been ascertained by WB and is shown on the right side. (D) HMGA1 and RSK2 co-immunoprecipitation (co–IP) analysis performed with MDA-MB-231 lysates. Input lysate was loaded in lane 1. Lanes 2 and 3 display immunoglobulins (IgG) immunoprecipitates (controls), while lanes 4 and 5 display HMGA1 immunoprecipitates. Lanes 3 and 5 show co–IPs performed with lysates treated with DNase I. WB analyses of HMGA1 and RSK2 are reported. The efficiency of DNase I digestion is shown on the right side.

