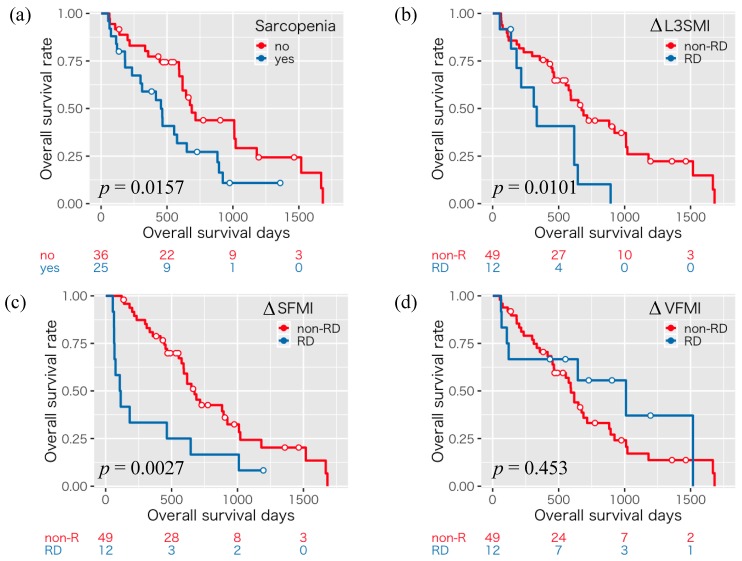
Figure 1.
Kaplan–Meier curves for overall survival time divided into the presence or absence of sarcopenia (a) and rapid depletion (RD) or non-rapid depletion (non-RD) groups in ΔL3SMI (≤−5.73 and >−5.73 cm2/m2/120 days) (b), ΔSFMI (≤−5.33 and >−5.33 cm2/m2/120days) (c), and ΔVFMI (≤−3.95 and >−3.95 cm2/m2/120 days) (d).

